3.6 Surface Texture/Finish
D.M. Donner
All manufacturing processes create tooling marks on the finished part. If you build a snowman in the front yard, you will leave behind an indentation where your gloves packed the snow together. If you are from warmer climates, maybe you make sandcastles on the beach by packing wet sand into a bucket and then turning it over to leave a bucket shaped mound. Any marks from inside the bucket transfer onto the sand that was molded in it. Or maybe you notice the pattern left behind by the vacuum cleaner on a nice plush carpet. Those marks are a surface finish. Manufacturers must create the correct surface finish as per the engineer’s drawing.
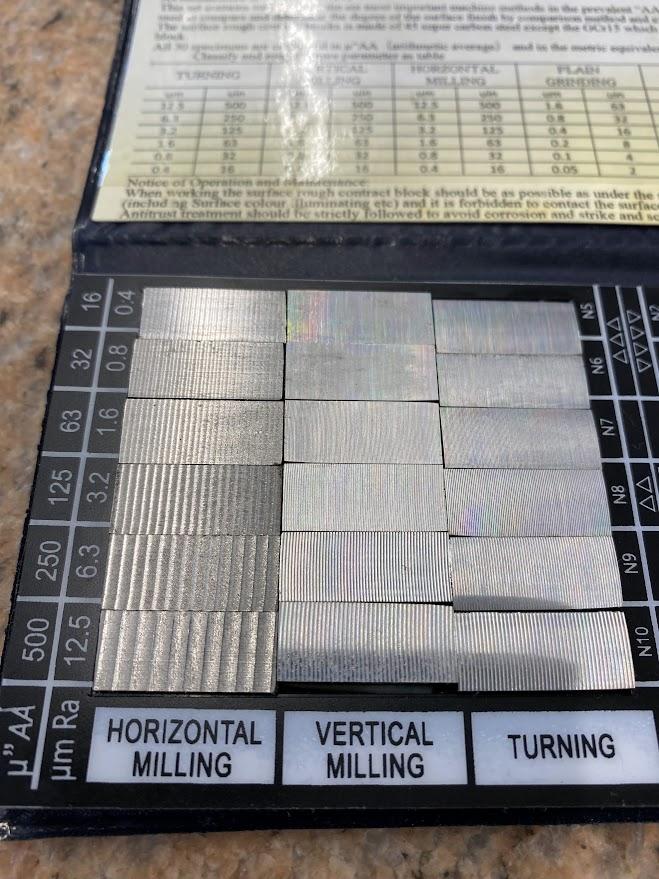
Figure 3.31 has a sample surface finish that an operator must examine and compare to the tooling marks on the finished part. Both metric and inch Ra (Roughness Average) scales are listed on either end of the samples. Tooling mark samples are commonly used for reaming, grinding, milling, and turning. Different processes will produce different finishes. For example, grinding and lapping create the finest surface finishes. Over time, you will get to know the finish produced by the various processes.
Units of Measure
Surface texture or roughness is very fine definition where the grooves that tools leave behind are quite small. The symbol (µ), meaning micro, is used to express a micro inch (µin) or a micrometer (µm), reflecting a millionth of an inch (.000001 inch) or a millionth of a meter (0.000001 meter). This is small stuff and may not be used in all industries. Aviation and the medical field however, use these measures often. For example, if you send a part out for anodizing and the surface finish is out of tolerance, the anodized surface will magnify any blemish, resulting in scraped parts.
The title block will call out the surface finish/texture if it applies, and the tolerance is expressed in maximum allowed tolerance. For example, if the print calls out a surface finish of 32 Ra µin, then any number less than 32 is acceptable.
Roughness Average (Ra)
Surface finish roughness average (Ra) is a common unit of measurement for surface roughness. It’s the arithmetic average of the heights of the microscopic peaks and valleys across a surface. Determining the roughness average requires a special piece of measuring equipment called a surface profilometer. A surface profilometeris used to measure the surface texture of a part.
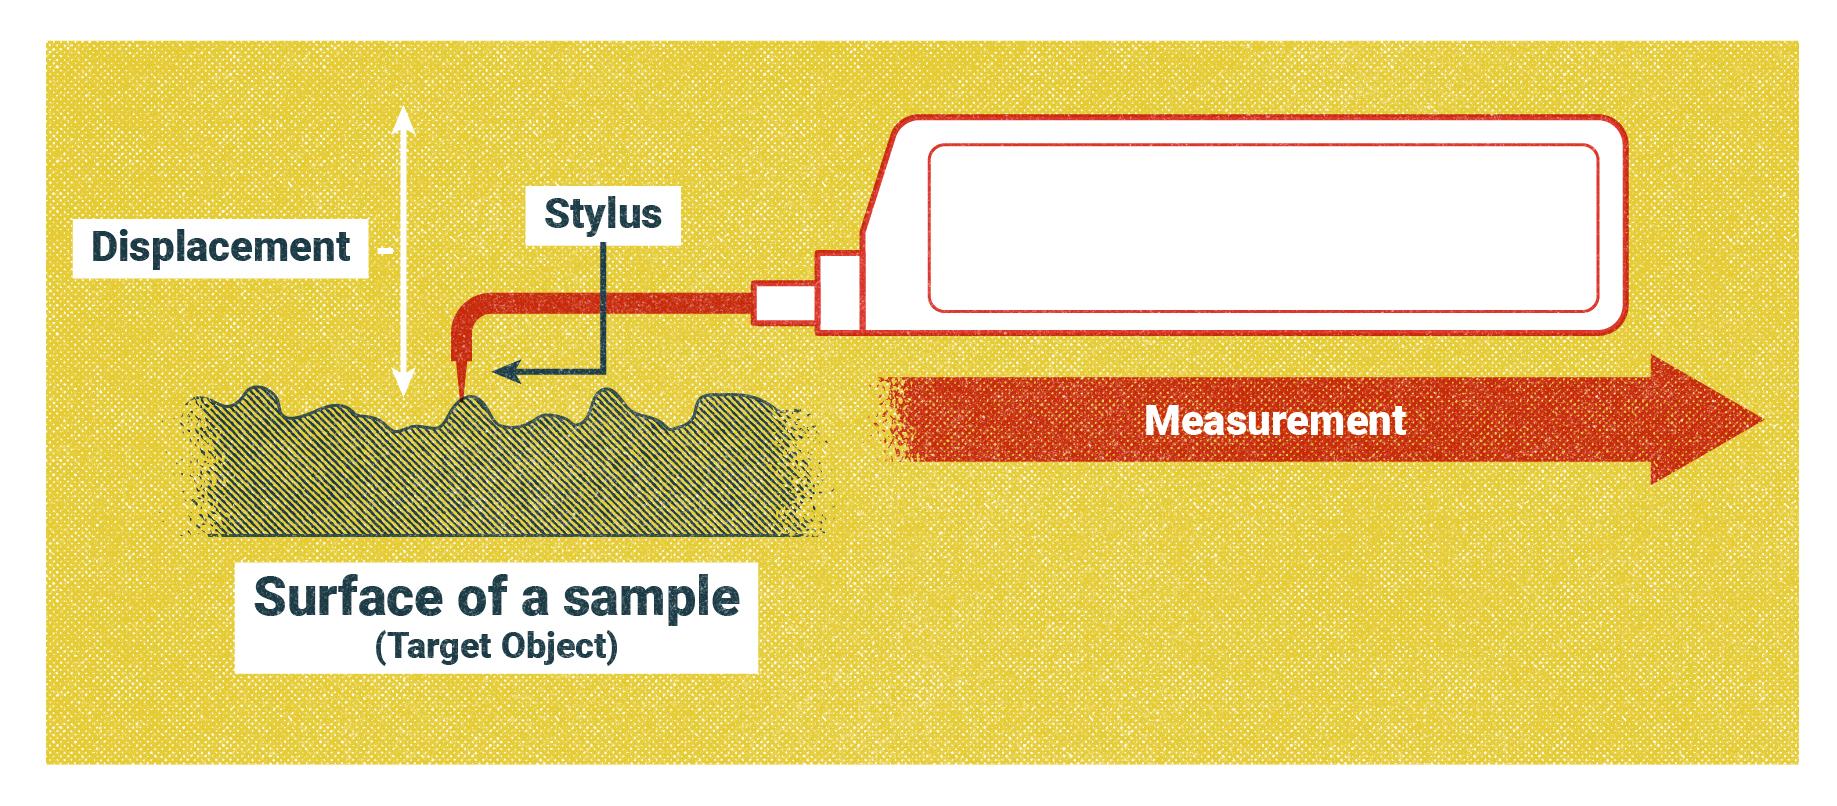
A surface profilometer has a very fine needle that is pulled across the surface to be measured. The needle and measuring equipment are sensitive enough to measure the peaks and valleys found on the surface. The Ra is determined by the distance/length the needle travels, i.e., .250″ and the maximum and minimum rise and fall of the needle. It is not necessary to understand how this function is calculated; just know that it is an average of the needle’s overall travel. The travel of the meter can be varied, and where you place the needle is important to the final reading.
Symbols
The basic symbol used for surface texture is (✓), a rather simple check mark. The purpose of surface texture marks is to call out specific surfaces on the print for which the surface finish is specified.
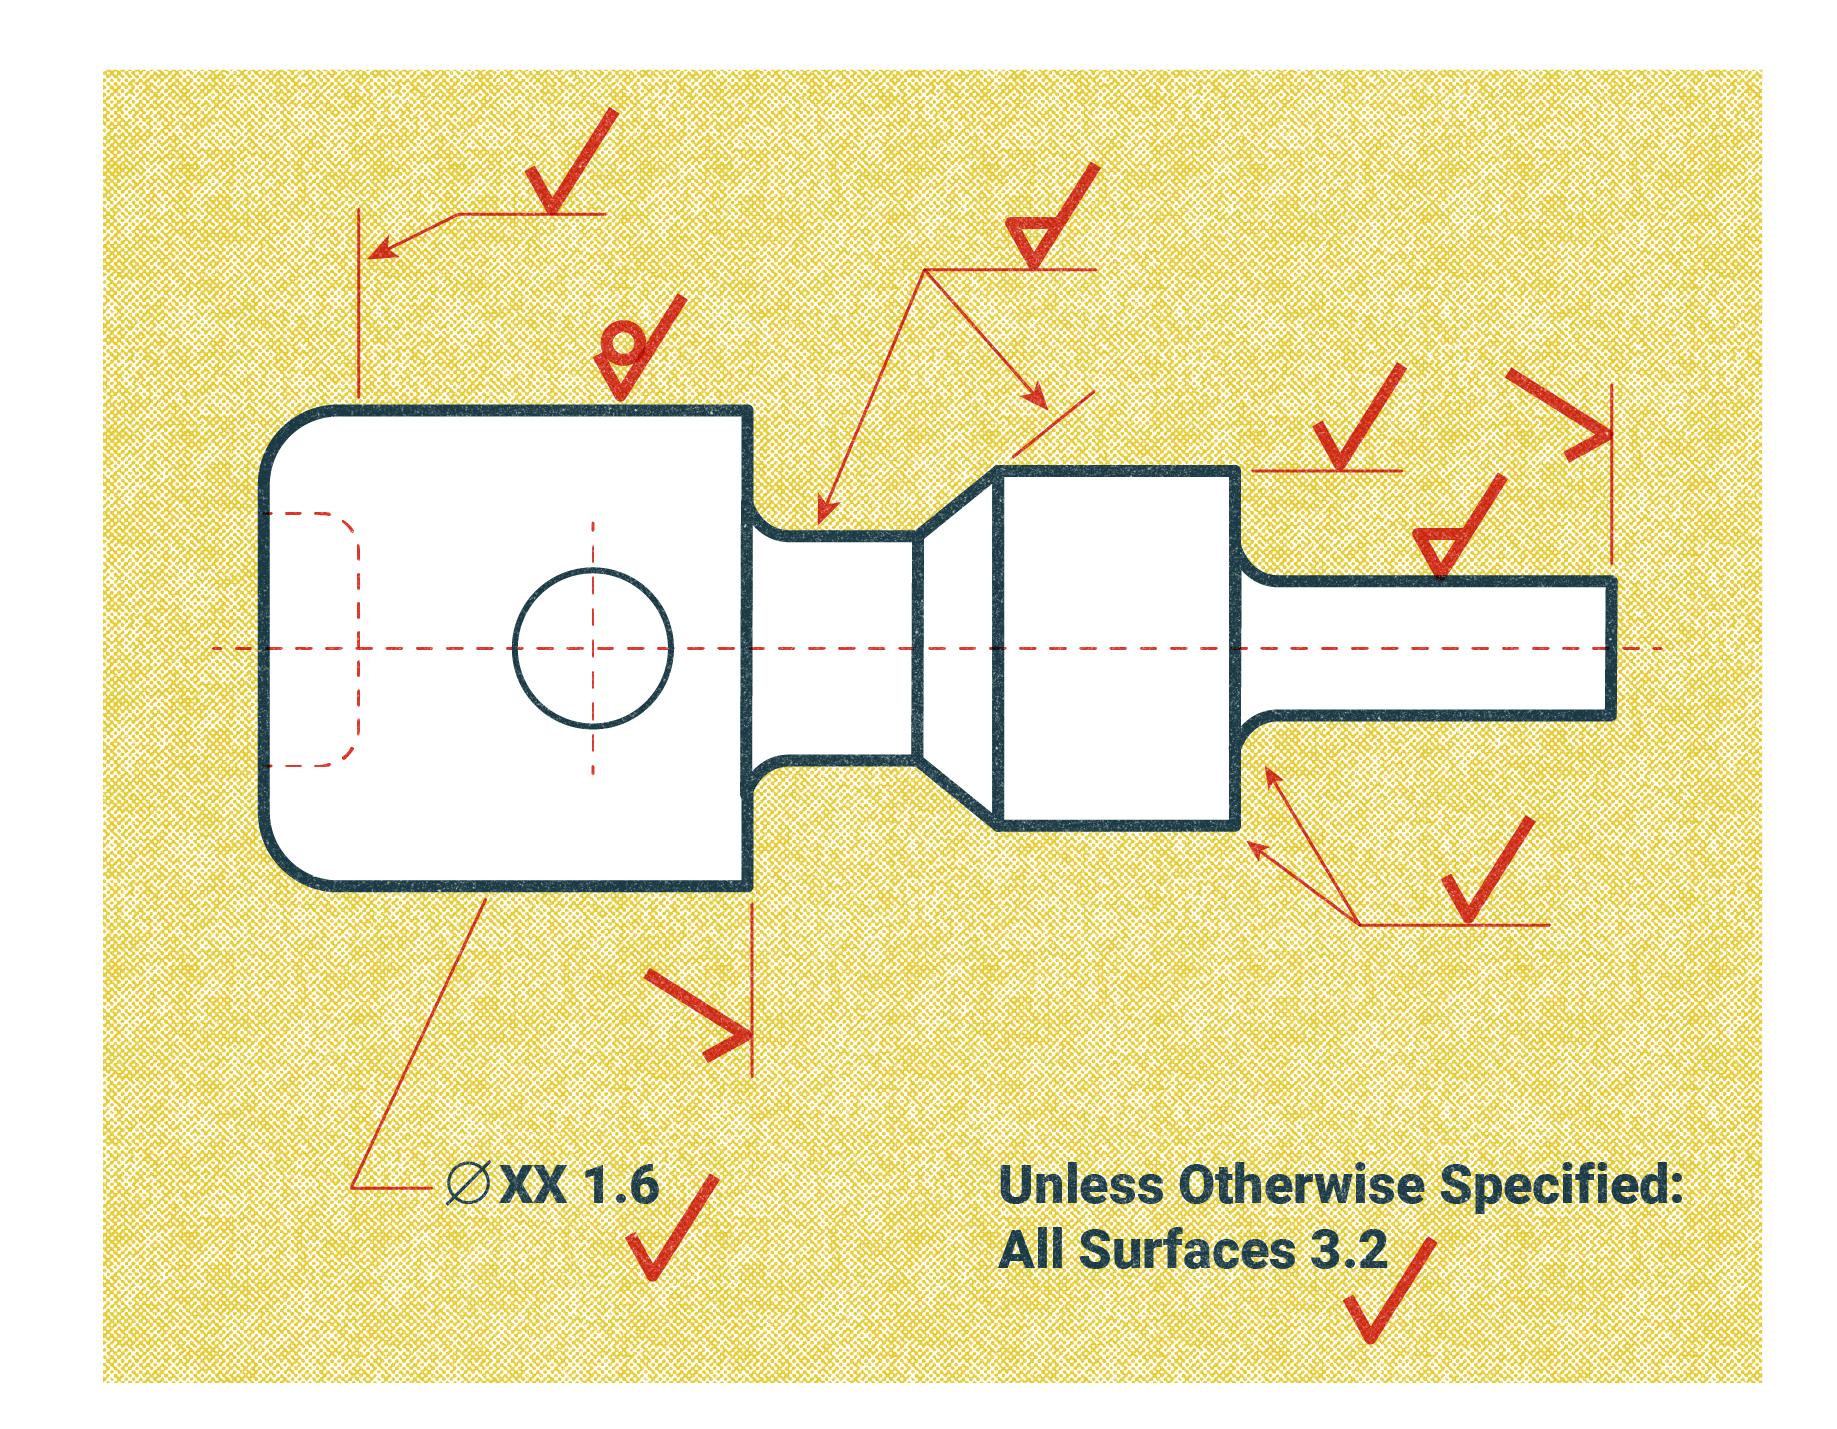
The various surface finish symbols in figure 3.33 have different meanings. This figure demonstrates how the symbols will be shown in the drawing area to designate a specific finish needed on a surface.
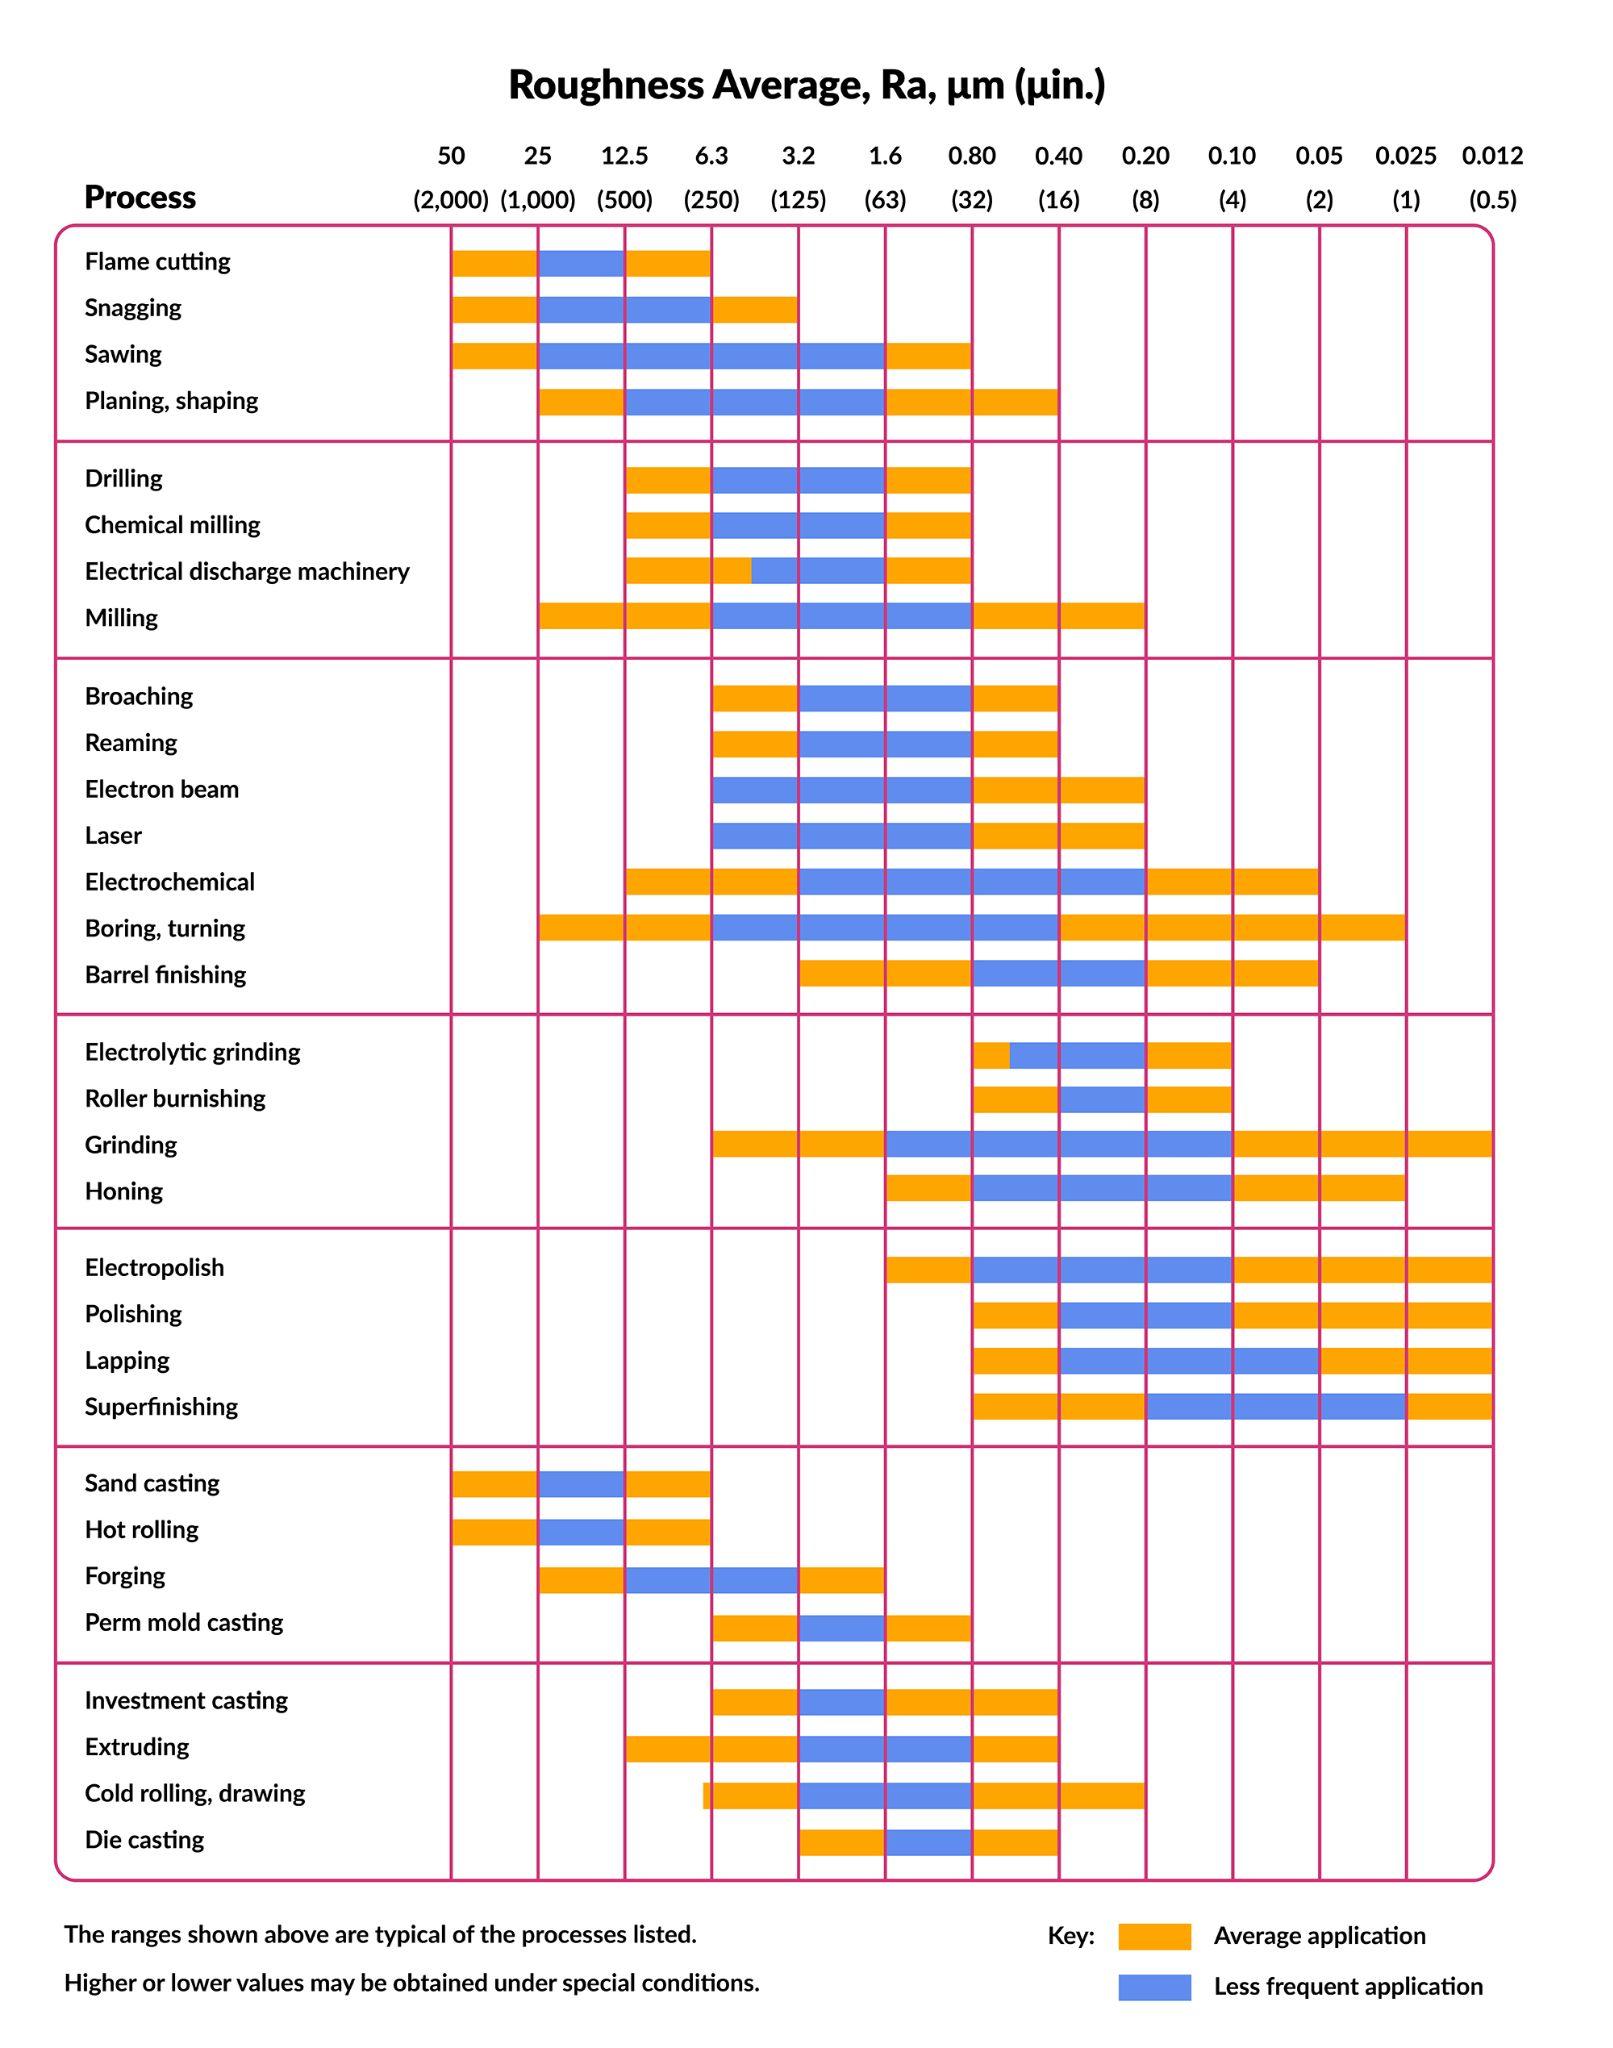
The figure above is a common graphic found in the industry. The graphic tells us several things about surface finish. This is a basic two-axis diagram where the top section represents desired surface finishes in both metric and inch. The inch callout is in parentheses.
The vertical left side column identifies which manufacturing process is capable of creating the desired finish. A 32 Ra µ in callout is most common, (µ is spoken as “micro inch” and is one millionth of an inch). Notice which processes permit such a finish. Since most of our work is centered around lathe and mill work, see the corresponding Ra for these processes. There is a bar with a dark portion and a lighter portion, where the dark section indicates the average application, and the lighter section indicates a less frequent application. In realistic terms, this means you must monitor the finish tool that creates the surface finish to ensure it is performing optimally.
| μm | μin | μm | μin | μm | μin |
|---|---|---|---|---|---|
| 0.012
0.025a 0.050a 0.075a 0.10a 0.125 0.15 0.20a 0.25 0.32 |
0.5
1a 2a 3 4a 5 6 8a 10 13 |
0.40a
0.50 0.63 0.80a 1.00 1.25 1.60a 2.0 2.5 3.2a |
16a
20 25 32a 40 50 63a 80 100 125a |
4.0
5.0 6.3a 8.0 10.0 12.5a 15 20 25a … |
160
200 250a 320 400 500a 600 800 1000a … |
Note. The entire scale of surface finish numbering presented in a table with the smallest on the left and the largest on the right. 1, 2, 4, 8, 16, 32, 125, 250 and 500 are indicated as the recommended surface finish callouts for the micro inch scale (Jones et al., 2004, Table 3, p. 734).
The above graphic has all the preferred values for the Ra scale in both metric and inch, with the superscript “a” representing the recommended values.
Attributions
- Figure 3.31: Surface finish comparison standards by Damon Donner, for WA Open ProfTech, © SBCTC, CC BY 4.0
- Figure 3.32: Surface profilometer reading a surface texture by Nicholas Malara, for WA Open ProfTech, © SBCTC, CC BY 4.0
- Figure 3.33: Application of surface finish by Nicholas Malara, for WA Open ProfTech, © SBCTC, CC BY 4.0
- Figure 3.34: Surface roughness produced by common production methods by Ezra Leigh, for WA Open ProfTech, © SBCTC, CC BY 4.0
The scratches left behind after a machining operation
It's the arithmetic average of the heights of the microscopic peaks and valleys across a surface
a tool used to measure the surface texture of a part. It can outout the actual roughness average measured on a part.
