3 Lab 2. Application of the Scientific Method using Daphnia magna
Lab 2. Application of the Scientific Method using Daphnia magna
OBJECTIVES
- Understand the steps and concepts of the “scientific method”.
- Define the terms used in this lab, including observations, hypothesis, independent variable, dependent variable, controlled variable, control group, experimental group.
- Identify the independent and dependent variables in an experiment.
- Practice obtaining data and making graphs using appropriate axis scaling and labelling.
- Practice applying hypothesis testing, and further your understanding of the basic principles underlying the scientific method and experimental design.
- Demonstrate different factors that influence the heart rate of Daphnia magna.
- Practice proper microscopy technique.
PRELAB (complete in your lab notebook):
- Define the following terms in your own words: dependent variable, independent variable, hypothesis.
- Draw a “flow chart” to diagram what you will do (and in what order).
- Write down the hypothesis, dependent, and independent variables in the Daphnia ethanol and caffeine experiment.
INTRODUCTION:
By working through a series of steps and terms, we will examine the thought process of “the scientific method”. This is a process used by many scientists, either explicitly or implicitly, to conduct their research. It is important to recognize, however, that while this is the major process used by scientists, it is by no means the only one. Science is a creative endeavor, as well – it also takes insight, creativity, and sometimes ideas just occur to people! In paleontology and field biology, for example, observation is often the primary method of research.
Steps of “the Scientific Method”
1. Make “Observations”
Initial observations may come from experiments or from experience. Most of our lives we make casual observations about the world around us. These observations may lead us to questions.
2. Ask Questions: the “Research Question(s)”
The whole science of biology is driven by curiosity, and essentially by biologists asking “Why”? or “How”? or “What?” or “When?” (e.g., questions about how things work). A good scientific question is one that is testable and (hopefully) answerable with some work and base knowledge.
3. Develop Hypotheses and Make Predictions
A hypothesis is a tentative explanation for what we observe based on background knowledge of the specific concept or a related concept. Think of a hypothesis as a possible answer to the question posed as a result of the observation. To be useful, a hypothesis must be testable or falsifiable; that is, you must be able to pose the statement in such a way that it can be either supported or disproven by experiment.
Once hypotheses have been stated, predictions can be made. A prediction is a statement of the expected results of an experiment based on the hypothesis. The prediction is often an “if … then …” statement, where the “if…” part is “If the hypothesis is true …”. The “then …” part is the prediction and states what you would expect to happen or to observe if the hypothesis were actually true.
Predictions are very important because they tell the scientist what to measure or look for and thus are integral in the design of the procedures of a study. The “then…” part should be in terms of the variables to be measured or observed.
Example of an ‘If… then’ statement: If I place my plants in direct sunlight, then they will grow taller.
4. Components of Experimental Design (Variables)
Variables are the factors that can influence the process that is being investigated. Three types of variables can be identified in experimental design:
The controlled variables are factors kept the same in the experimental and control treatments—and which might affect the result. The independent variable is the variable you manipulate, and the one that differs between the experimental and control groups. The dependent variable is what is measured, counted or observed at different conditions of the independent variable.
5. Perform a Study (Experiment) and Collect Data
Protocols developed during experimental design should be faithfully followed. Data must be collected and analyzed with great care.
An experimental group is composed of human subjects, animals, or other organisms, for which the independent variable is being manipulated. In medical research, an experimental group is often receiving some form of drug treatment. A control group is composed of subjects in which the experimental manipulation did not occur. In medical research, a control group is often one that is similar in many respects to the experimental group (with respect to age, gender, class, etc.) but is receiving no drug treatment or a placebo.
6. Analyze Data and Report Results
Results are an explanation of what happened during data collection and analysis. Scientists generally emphasize the important results, that is, the results that bear directly on the hypothesis, idea, or question under consideration. They do not say everything about all of the data: at best that would be tedious and unnecessary. These important results are used to explain what the data mean or imply in terms of the scientific topic under consideration. Essentially, the analysis asks whether the results support the prediction: did what we thought would happen, happen?
Data are often recorded into tables, and then illustrated using graphs. The data are then analyzed using mathematical methods to reduce the numbers to meaningful values. A good graph can explain the important results of your experiment in far less space than writing out the results. Graphs are an integral part of any scientific report, so interpreting their meanings is an important and useful skill. There are many types of graphs, but particular types of data fit better onto certain types of graphs (e.g. averages are reported more clearly using bar graphs).
7. Interpret Results and Draw Conclusions
Once the data have been recorded and displayed, conclusions can be drawn based on the results. Specific conclusions address whether the results of the study do or do not support the proposed hypothesis. If the hypothesis has not been supported, you must suggest alternate hypotheses based on your new knowledge. If the hypothesis has been supported, you may build on this by further testing the hypothesis. The conclusions of a scientific study relate the results of the particular experiment to the scientific field of interest. Conclusions often directly address previous data, hypotheses, or assumptions in the scientific literature.
PART 1: Heart rate of Daphnia upon exposure to ethanol and caffeine
Prior to coming to lab, view the following video on how to measure the heart rate of Daphnia:
(67) How to determine the normal heart rate of Daphnia magna – YouTube
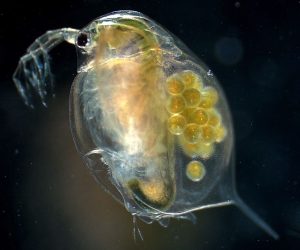
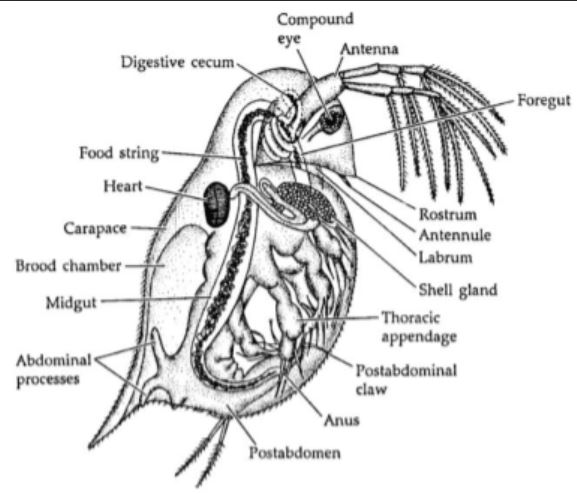
Daphnia magna, commonly known as water fleas, are freshwater arthropods with a clear external skeleton (carapace) and jointed appendages. Heart rate (heart beats per minute) of Daphnia has previously been shown to be sensitive to various chemical exposures. In this experiment, you will examine the heart rate of Daphnia upon ethanol and caffeine exposure. In humans, caffeine is a well-known stimulant that increases heart rate, while ethanol is a depressant that decreases heart rate.
The purpose of this study is to determine if heart rate in D. magna behaves similarly to the heart rate of humans when exposed to caffeine and ethanol.
Please work in a group of four for this experiment. Two members of the group should measure the effects of caffeine on heart rate, while the other two members should measure the effects of ethanol on heart rate. Share your data with your group members.
MATERIALS
Daphnia in culture liquid
Transfer pipettes
Depression slides
Compound microscope or Stereoscope
A small container for “used” Daphnia
1%, 2% and 4% ethanol in a dropper bottle
0.5%, 1% and 1.5% caffeine in a dropper bottle
EXPERIMENTAL PROCEDURE
- Using a clean pipette, carefully transfer a Daphnia onto a depression slide.
- Place the slide under the microscope and focus on the Daphnia so that you can see the beating heart.
- Have your lab partner time 20 seconds for you as you count the number of heartbeats during that 20 second interval. You want to make your measurements quickly, so that the Daphnia does not become stressed in the small volume of water and under the heat of the microscope.
- Record the number of heart beats in the data table on the next page. Multiply the number by 3 to get the number of beats per minute (bpm).
- Take at least three separate heart rate measurements for each individual Daphnia and calculate the average of the three measurements.
- When you have finished recording the heart rate in water (the CONTROL solution), remove as much water as you can from the depression slide using a transfer pipette. Then add ONE DROP of the 1% ethanol solution to the slide. Turn the light OFF and wait 30 seconds.
- Turn the light back on and count the number of heart beats for 20 seconds again, repeating at least 3 times. Multiply each count by 3 to get the heart rate per minute. Record in data table.
- Place the Daphnia into the “used” container, clear off depression slide, then repeat steps # 1-9 with a new Daphnia two more times.
- Repeat the above steps # 1-9 using the caffeine solutions.
You will use three different Daphnia for each of the three ethanol solutions and you will use three different Daphnia for each of the three caffeine solutions. In other words, a total of 9 Daphnia will be used to look at the effects of ethanol on heart rate in Daphnia, and a total of 9 Daphnia will be used to look at the effects of caffeine on heart rate in Daphnia.
RESULTS AND DATA COLLECTION
Please fill out the following tables. You may cut and paste (using tape or glue) these tables into your lab notebook.
Table 1. Heart rate of Daphnia upon exposure to 1% ethanol.
| Water | 1% Ethanol | |||
| Daphnia 1 | 20 Seconds | Beats per minute
(20 sec x 3) |
20 Seconds | Beats per minute
(20 sec x 3) |
| 1 | ||||
| 2 | ||||
| 3 | ||||
| Daphnia 2 | ||||
| 1 | ||||
| 2 | ||||
| 3 | ||||
| Daphnia 3 | ||||
| 1 | ||||
| 2 | ||||
| 3 | ||||
| MEAN | XXXXXXXXXXXXXXXXXX | XXXXXXXXXXXXXXXXXX | ||
Table 2. Heart rate of Daphnia upon exposure to 2% ethanol.
| Water | 2% Ethanol | |||
| Daphnia 1 | 20 Seconds | Beats per minute
(20 sec x 3) |
20 Seconds | Beats per minute
(20 sec x 3) |
| 1 | ||||
| 2 | ||||
| 3 | ||||
| Daphnia 2 | ||||
| 1 | ||||
| 2 | ||||
| 3 | ||||
| Daphnia 3 | ||||
| 1 | ||||
| 2 | ||||
| 3 | ||||
| MEAN | XXXXXXXXXXXXXXXXXX | XXXXXXXXXXXXXXXXXX | ||
Table 3. Heart rate of Daphnia upon exposure to 4% ethanol.
| Water | 4% Ethanol | |||
| Daphnia 1 | 20 Seconds | Beats per minute
(20 sec x 3) |
20 Seconds | Beats per minute
(20 sec x 3) |
| 1 | ||||
| 2 | ||||
| 3 | ||||
| Daphnia 2 | ||||
| 1 | ||||
| 2 | ||||
| 3 | ||||
| Daphnia 3 | ||||
| 1 | ||||
| 2 | ||||
| 3 | ||||
| MEAN | XXXXXXXXXXXXXXXXXX | XXXXXXXXXXXXXXXXXX | ||
Table 4. Heart rate of Daphnia upon exposure to 0.5% caffeine.
| Water | 0.5% Caffeine | |||
| Daphnia 1 | 20 Seconds | Beats per minute
(20 sec x 3) |
20 Seconds | Beats per minute
(20 sec x 3) |
| 1 | ||||
| 2 | ||||
| 3 | ||||
| Daphnia 2 | ||||
| 1 | ||||
| 2 | ||||
| 3 | ||||
| Daphnia 3 | ||||
| 1 | ||||
| 2 | ||||
| 3 | ||||
| MEAN | XXXXXXXXXXXXXXXXXX | XXXXXXXXXXXXXXXXXX | ||
Table 5. Heart rate of Daphnia upon exposure to 1% caffeine.
| Water | 1% Caffeine | |||
| Daphnia 1 | 20 Seconds | Beats per minute
(20 sec x 3) |
20 Seconds | Beats per minute
(20 sec x 3) |
| 1 | ||||
| 2 | ||||
| 3 | ||||
| Daphnia 2 | ||||
| 1 | ||||
| 2 | ||||
| 3 | ||||
| Daphnia 3 | ||||
| 1 | ||||
| 2 | ||||
| 3 | ||||
| MEAN | XXXXXXXXXXXXXXXXXX | XXXXXXXXXXXXXXXXXX | ||
Table 6. Heart rate of Daphnia upon exposure to 1.5% caffeine.
| Water | 1% Caffeine | |||
| Daphnia 1 | 20 Seconds | Beats per minute
(20 sec x 3) |
20 Seconds | Beats per minute
(20 sec x 3) |
| 1 | ||||
| 2 | ||||
| 3 | ||||
| Daphnia 2 | ||||
| 1 | ||||
| 2 | ||||
| 3 | ||||
| Daphnia 3 | ||||
| 1 | ||||
| 2 | ||||
| 3 | ||||
| MEAN | XXXXXXXXXXXXXXXXXX | XXXXXXXXXXXXXXXXXX | ||
PLEASE COMPLETE THE FOLLOWING SECTIONS IN YOUR LAB NOTEBOOK REGARDING THE DAPHNIA EXPERIMENT ABOVE:
DATA ANALYSIS
Graph these data in your lab notebook. Each student must produce their own graph and the graphs should be hand drawn in your notebook. Note that the dependent variable should be on the Y axis and the independent variable on the X axis. Include a legend or key and an informative caption below the graph including the sample size for each treatment.
INTERPRETATION
Based on your data, what are the effects of ethanol and caffeine on heart rate in Daphnia? Explain your conclusions. What do you think would happen if you left Daphnia in each solution over a period of 30 minutes or several hours?
ERROR ANALYSIS
What mistakes occurred? If none occurred, what mistakes could have occurred?
What other sources of error can you think of, besides any mistakes?
