9.1 Measures of Central Tendency
Applications
As long as we have Bull Trout (Salvelinus confluentus) on our minds...
We're sampling Bull Trout in the Bull River watershed. Let's say we electrofish, collect, and measure 240 fish. We have total length in millimeters and weight in grams for each fish. What do we do with this data next? What would you want to know? What might biologists managing this species want to know?


We often describe data using a measure of central tendency. This is a number that we use to describe the typical data value. In this section, we will look at three measures of central tendency: the mean, the median, and the mode. Each of these has pros and cons, depending on the particular data set.
Mean
The mean of a set of data is what we commonly call the average: add up all of the numbers and then divide by how many numbers there were.
Exercises
- The table below shows the amount of time, rounded to the nearest half minute, it took Marty to complete the Friday crossword puzzle in the New York Times. Calculate the mean completion time for these thirteen puzzles.
Oct 6, 2023 [latex]10.0\text{ min}[/latex] Oct 13, 2023 [latex]13.0\text{ min}[/latex] Oct 20, 2023 [latex]11.0\text{ min}[/latex] Oct 27, 2023 [latex]9.0\text{ min}[/latex] Nov 3, 2023 [latex]8.5\text{ min}[/latex] Nov 10, 2023 [latex]9.5\text{ min}[/latex] Nov 17, 2023 [latex]11.0\text{ min}[/latex] Nov 24, 2023 [latex]12.0\text{ min}[/latex] Dec 1, 2023 [latex]11.5\text{ min}[/latex] Dec 8, 2023 [latex]9.5\text{ min}[/latex] Dec 15, 2023 [latex]11.0\text{ min}[/latex] Dec 22, 2023 [latex]11.0\text{ min}[/latex] Dec 29, 2023 [latex]7.0\text{ min}[/latex] - The table below shows the average price of a gallon of regular unleaded gasoline in the Seattle metro area for ten weeks in late 2023.[1] Compute the mean price over this time period.
Oct 23, 2023 [latex]\$4.81[/latex] Oct 30, 2023 [latex]\$4.70[/latex] Nov 6, 2023 [latex]\$4.63[/latex] Nov 13, 2023 [latex]\$4.57[/latex] Nov 20, 2023 [latex]\$4.49[/latex] Nov 27, 2023 [latex]\$4.45[/latex] Dec 4, 2023 [latex]\$4.39[/latex] Dec 11, 2023 [latex]\$4.34[/latex] Dec 18, 2023 [latex]\$4.28[/latex] Dec 25, 2023 [latex]\$4.22[/latex]
Median
The median is the middle number in a set of data; it has an equal number of data values below it as above it. The numbers must be arranged in order, usually smallest to largest but largest to smallest would also work. Then we can count in from both ends of the list and find the median in the middle.
If there are an odd number of data values, there will be one number in the middle, which is the median.
If there are an even number of data values, there will be two numbers in the middle. The mean of these two numbers is the median.
Exercises
- Here are Marty's Friday crossword puzzle completion times again, in minutes, listed in order from fastest to slowest. What is the median completion time? [latex]7.0, 8.5, 9.0, 9.5, 9.5, 10.0, 11.0, 11.0, 11.0, 11.0, 11.5, 12.0, 13.0[/latex]
- Here are the Seattle gas prices again, listed in order from lowest to highest. What is the median price? [latex]\$4.22[/latex], [latex]\$4.28[/latex], [latex]\$4.34[/latex], [latex]\$4.39[/latex], [latex]\$4.45[/latex], [latex]\$4.49[/latex], [latex]\$4.57[/latex], [latex]\$4.63[/latex], [latex]\$4.70[/latex], [latex]\$4.81[/latex]
The five houses on a block have these property values: [latex]\$250,000[/latex]; [latex]\$300,000[/latex]; [latex]\$320,000[/latex]; [latex]\$190,000[/latex]; [latex]\$220,000[/latex].
- Find the mean property value.
- Find the median property value.
A new house is built on the block, making the property values [latex]\$250,000[/latex]; [latex]\$300,000[/latex]; [latex]\$320,000[/latex]; [latex]\$190,000[/latex]; [latex]\$220,000[/latex]; [latex]\$750,000[/latex].
- Find the mean property value.
- Find the median property value.
- Which of these measures appears to give a more accurate representation of the typical house on the block?
The mean is better to work with when we do more complicated statistical analysis, but it is sensitive to extreme values; in other words, one very large or very small number can have a significant effect on the mean. The median is not sensitive to extreme values, which can make it a better measure to use when describing data that has one or two numbers very different from the remainder of the data.
Mode
The mode is the value that appears most frequently in the data set. On the game show Family Feud, the goal is to guess the mode: the most popular answer.
If no numbers are repeated, then the data set has no mode. If there are two values that are tied for most frequently occurring, then they are both considered a mode and the data set is called bimodal. If there are more than two values tied for the lead, we usually say that there is no mode.[2] (It's like in sports: there is usually one MVP, but occasionally there are two co-MVPs. Having three or more MVPs would start to get ridiculous.)
Exercises
- Here are Marty's Friday crossword puzzle completion times one last time, in minutes. What is the mode of the completion times? [latex]7.0, 8.5, 9.0, 9.5, 9.5, 10.0, 11.0, 11.0, 11.0, 11.0, 11.5, 12.0, 13.0[/latex]
- Here are the Seattle gas prices one last time. What is the mode of the prices? [latex]\$4.22[/latex], [latex]\$4.28[/latex], [latex]\$4.34[/latex], [latex]\$4.39[/latex], [latex]\$4.45[/latex], [latex]\$4.49[/latex], [latex]\$4.57[/latex], [latex]\$4.63[/latex], [latex]\$4.70[/latex], [latex]\$4.81[/latex]
- One hundred cell phone owners are asked which carrier they use. What is the mode of the data?
AT&T Mobility Verizon Wireless T-Mobile US Dish Wireless U.S. Cellular [latex]43[/latex] [latex]29[/latex] [latex]24[/latex] [latex]2[/latex] [latex]2[/latex] - Fifty people are asked what their favorite type of Girl Scout cookie is. What is the mode?
S’Mores Samoas Tagalongs Trefoils Thin Mints [latex]4[/latex] [latex]16[/latex] [latex]5[/latex] [latex]9[/latex] [latex]16[/latex]
Examples: Finding the Mean, Median, and Mode
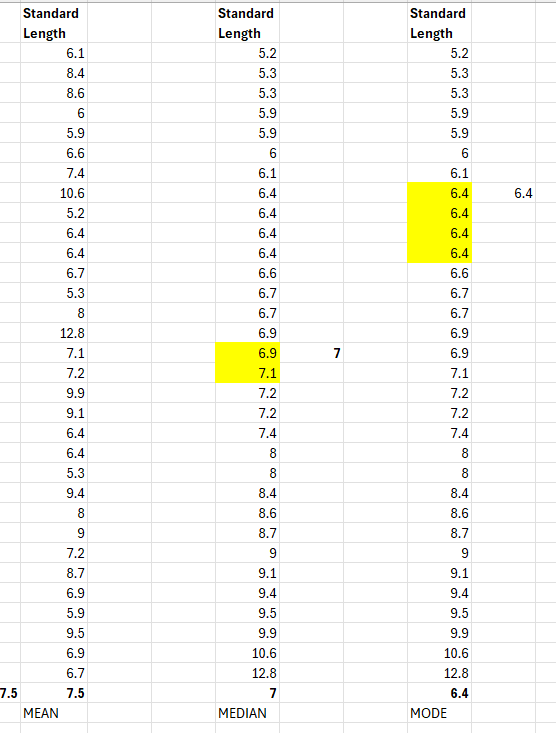
Find the mean, median and mode for this data set.
| Standard Length |
| 6.1 |
| 8.4 |
| 8.6 |
| 6 |
| 5.9 |
| 6.6 |
| 7.4 |
| 10.6 |
| 5.2 |
| 6.4 |
| 6.4 |
| 6.7 |
| 5.3 |
| 8 |
| 12.8 |
| 7.1 |
| 7.2 |
| 9.9 |
| 9.1 |
| 6.4 |
| 6.4 |
| 5.3 |
| 9.4 |
| 8 |
| 9 |
| 7.2 |
| 8.7 |
| 6.9 |
| 5.9 |
| 9.5 |
| 6.9 |
| 6.7 |
Let's put it all together and find the mean, median, and mode of some data sets. Sportsball!
Exercises
[latex]11[/latex], [latex]9[/latex], [latex]14[/latex], [latex]14[/latex], [latex]10[/latex], [latex]12[/latex], [latex]16[/latex], [latex]11[/latex], [latex]10[/latex], [latex]14[/latex], [latex]13[/latex], [latex]12[/latex], [latex]12[/latex], [latex]12[/latex], [latex]12[/latex], [latex]14[/latex], [latex]13[/latex], [latex]11[/latex], [latex]12[/latex].
- Find the mean number of games won from 2001 to 2019.
- Find the median number of games won from 2001 to 2019.
- Find the mode of the number of games won from 2001 to 2019.
- Do any of these measures appear to be misleading, or do they all represent the data fairly well?
From 2001-2019, these are the numbers of games won by the Buffalo Bills each NFL season.[4]
[latex]3[/latex], [latex]8[/latex], [latex]6[/latex], [latex]9[/latex], [latex]5[/latex], [latex]7[/latex], [latex]7[/latex], [latex]7[/latex], [latex]6[/latex], [latex]4[/latex], [latex]6[/latex], [latex]6[/latex], [latex]6[/latex], [latex]9[/latex], [latex]8[/latex], [latex]7[/latex], [latex]9[/latex], [latex]6[/latex], [latex]10[/latex].
- Find the mean number of games won from 2001 to 2019.
- Find the median number of games won from 2001 to 2019.
- Find the mode of the number of games won from 2001 to 2019.
- Do any of these measures appear to be misleading, or do they all represent the data fairly well?
Some sets of data may not be easy to describe with one measure of central tendency.
Exercises
Thirteen clementines are weighed. Their masses, in grams, are
[latex]82[/latex], [latex]90[/latex], [latex]90[/latex], [latex]92[/latex], [latex]93[/latex], [latex]94[/latex], [latex]94[/latex], [latex]102[/latex], [latex]107[/latex], [latex]107[/latex], [latex]108[/latex], [latex]109[/latex], [latex]109[/latex].
- Determine the mean. Does the mean appear to represent the mass of a typical clementine?
- Determine the median. Does the median appear to represent the mass of a typical clementine?
- Determine the mode. Does the mode appear to represent the mass of a typical clementine?
Suppose that the [latex]108[/latex]-gram clementine is a tiny bit heavier and the masses are actually
[latex]82[/latex], [latex]90[/latex], [latex]90[/latex], [latex]92[/latex], [latex]93[/latex], [latex]94[/latex], [latex]94[/latex], [latex]102[/latex], [latex]107[/latex], [latex]107[/latex], [latex]109[/latex], [latex]109[/latex], [latex]109[/latex].
- Determine the new mean. Is the new mean different from the original mean?
- Determine the new median. Is the new median different from the original median?
- Determine the new mode. Is the new mode different from the original mode? Does it represent the mass of a typical clementine?
Problem Set 9.1
- Find the mean, median and mode of this data set.
Tail length (cm) 0.49 0.54 0.63 0.54 0.58 0.40 0.41 0.43 0.67 0.45 - Find the mean, median and mode of this data set.
| Cosmic Crisp apple weight (g) |
| 201.8 |
| 200.3 |
| 200.1 |
| 199.9 |
| 202.4 |
| 202.5 |
| 200.6 |
| 200.6 |
| 199.3 |
| 201.0 |
| 197.2 |
| 200.6 |
3. Find the mean, median and mode of this data set.
| Chokecherry seed weight (g) |
| 8.2 |
| 12.7 |
| 12.6 |
| -0.4 |
| 8.1 |
| 8.8 |
| 12.4 |
| 9.5 |
4. Find the mean, median and mode of this data set.
| Sporophyte height above phyllids (cm) |
| -1.6 |
| 0.2 |
| 7.1 |
| 12.3 |
| 1.3 |
| 9.2 |
| 3.4 |
| 10.6 |
| -4.4 |
| 0.6 |
| 7.5 |
| 3.8 |
| 7.7 |
| -2.0 |
| 5.5 |
| -4.6 |
| -3.9 |
| 15.0 |
| 7.6 |
5. Find the mean, median and mode of this data set.
| Anther length cm |
| 0.238 |
| 0.254 |
| 0.300 |
| 0.258 |
| 0.240 |
| 0.233 |
| 0.283 |
| 0.246 |
| 0.268 |
| 0.249 |
| 0.259 |
| 0.255 |
| 0.227 |
| 0.262 |
- Source: https://www.eia.gov/petroleum/gasdiesel/ ↵
- The concepts of trimodal and multimodal data exist, but we aren't going to consider anything beyond bimodal in this textbook. ↵
- Source: https://www.pro-football-reference.com/teams/nwe/index.htm ↵
- Source: https://www.pro-football-reference.com/teams/buf/index.htm ↵
