5.1 When & How Does Interpolation Work
Applications
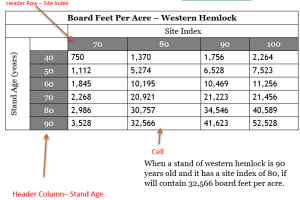
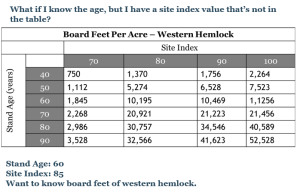
Stand tables use on-the-ground measurements of forest volume (in board feet) over time to predict how a tree species will grow on sites of similar quality. These measurements are generally reported in five to ten year increments for sites of specific quality (site index).
Sometimes, we are on a site that doesn't quite match the information we have in a stand table. Maybe the site index isn't represented in our table - or we want to know what the volume in the stand will be at an interval that's not five or ten years.
This is where table interpolation is valuable. It allows us to calculate the values between measured cells in a table, and we'll use it for a variety of tables in addition to forestry stand tables.
Table interpolation sounds exotic, but it's pretty straightforward and usually a favorite for students. The idea is that we can estimate the value between any two cells in a table by assuming that the values change in a linear (i.e. proportional) way between cells.
This will make the most sense when you see it in action!
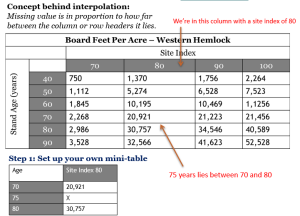
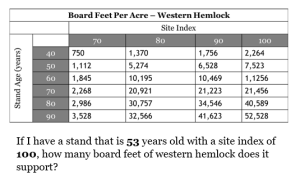
What if I want to know how many board feet of western hemlock will be present in a stand with a site index of 80 when it is 75 years old? The table below has cell values for stands that are 70 years old and 80 years old.
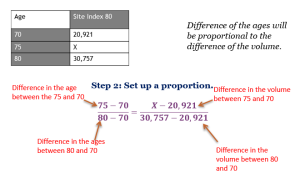
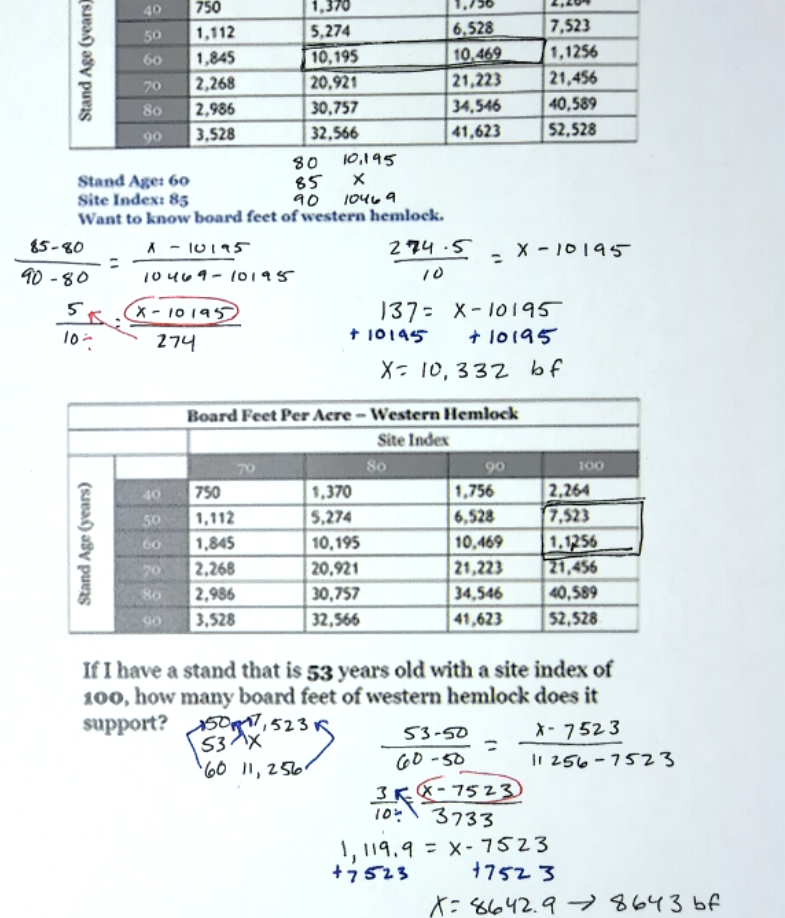
We start by pulling out the values we will work with into a "mini-table." The headers that we are looking between go in the left column and the cell values go in the right column.
Then, we set up a proportion under the assumption that the difference between the header values is proportional to the difference between the cell values. The last step is solving our proportion.
Last, we solve the proportion. Given that we haven't spent any time reviewing algebra - I'm going to take us the most straightforward way to finding the value of X in this proportion.
Do the easy arithmetic in the numerator and denominator of each side of the proportion.
[latex]\frac{75-70}{80-70}=\frac{X-20,921}{30,757-20,921}[/latex]
[latex]\frac{5}{10}=\frac{X-20,921}{9,836}[/latex]
Then, treat the numerator on the right like the unknown in a proportion that you're using cross multiplication to solve. Leave it alone while you multiply across the diagonal and divide by the denominator on the left.
[latex]\frac{9,836\cdot 5}{10}=X-20,921[/latex]
[latex]4,918=X-20,921[/latex]
Finally, find X. Isolate X by adding or subtracting the number next to it from both sides of the equation.
[latex]4,918=X-20,921[/latex]
[latex]+20,921 +20,921[/latex]
[latex]X = 25,839[/latex]
To recap, here are the steps to interpolating between cell values:
- Pull out the relevant values in a mini table with the headers in the left column and cell values in the right.
- Set up a proportion with the header values on the left and the cell values on the right.
- Solve the proportion for the unknown cell value.
- Do the simple arithmetic
- Use cross multiplication to get the numerator that has the variable alone
- Use addition or subtraction (depending on the sign) to solve for the unknown (X)
The limitation to interpolation is the assumption that values in the cells are proportional to the header values. Over small spans, this is often true or close enough. If we try to interpolate over broad gaps or on data that are far from linear, our results will not be accurate. In those cases, you might want to examine and plot the data to develop an equation for the relationship.
Examples: Using Interpolation on Simple Tables
Problem Set 5.1
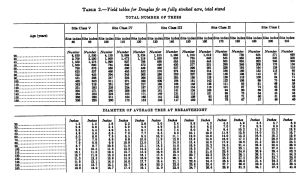
Use the following stand table for the interpolations below. The cell numbers are in board feet per acre.
SITE INDEX
| AGE | 10 | 20 | 30 | 40 | 50 | 60 | 70 | 80 | 90 |
| 25 | 1,250 | 1,370 | 1,503 | 1,852 | 2,005 | 2,150 | 2,260 | 2,400 | 2,630 |
| 30 | 1,300 | 1,400 | 1,620 | 1,968 | 2,120 | 2,200 | 2,320 | 2,480 | 2,750 |
| 35 | 1,375 | 1,490 | 1,750 | 2,120 | 2,400 | 2,420 | 2,430 | 2,520 | 2,820 |
| 40 | 1,395 | 1,600 | 1,820 | 2,225 | 2,520 | 2,590 | 2,520 | 2,628 | 2,950 |
| 45 | 1,450 | 1,700 | 1,978 | 2,456 | 2,650 | 2,685 | 2,698 | 2,795 | 3,102 |
| 50 | 1,569 | 1,850 | 2,005 | 2,598 | 2,856 | 2,960 | 2,985 | 2,950 | 3,200 |
| 55 | 1,680 | 1,968 | 2,120 | 2,680 | 2,950 | 3,052 | 3,100 | 3,210 | 3,350 |
How many board feet are in each stand under the following conditions?
- Age 35 Site Index 50
- Age 32 Site Index 50
- Age 48 Site Index 70
- Age 50 Site Index 42
- Age 55 Site Index 88
