7.1 Perimeter
Applications
What is my favorite application for perimeter calculations? Fencing!
If you work in habitat restoration, it's likely you'll have an opportunity to build or maintain fenceline to keep cattle (or other grazers or tramplers) out of a sensitive area.

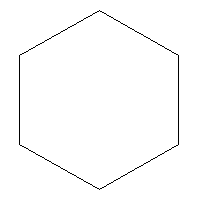
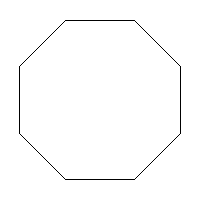
A polygon is a closed geometric figure with straight sides. Common polygons include triangles, squares, rectangles, parallelograms, trapezoids, pentagons, hexagons, octagons… Just as a perimeter fence runs along the outside edge of a region, the perimeter of a polygon is the total distance around the outside. In general, to find the perimeter of a polygon, you can add up the lengths of all of its sides.
Also, if you haven't already, now is the time to get in the habit of including units in your answers.
Practice Exercises
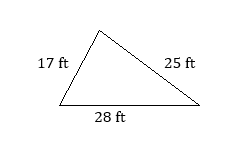
- Find the perimeter of the triangle.
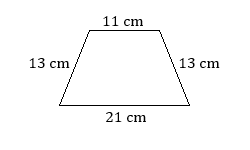
- Find the perimeter of the trapezoid.
If we know that some of the sides of a polygon are equal, we can use a formula as an alternative to adding up all of the lengths individually. The first formula shown below uses the variable [latex]s[/latex] for the side of a square. The rectangle formulas use [latex]l[/latex] for length and [latex]w[/latex] for width, or [latex]b[/latex] for base and [latex]h[/latex] for height; these terms are interchangeable.
Perimeter Formulas
Square: [latex]P=4s[/latex]
Rectangle: [latex]P=2l+2w[/latex] or [latex]P=2b+2h[/latex]
Rectangle: [latex]P=2(l+w)[/latex] or [latex]P=2(b+h)[/latex]
Practice Exercises
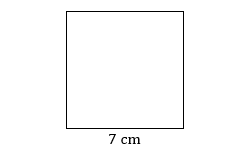
- Find the perimeter of the square.
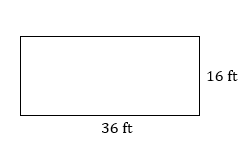
- Find the perimeter of the rectangle.
- A storage area, which is a rectangle that is [latex]45[/latex] feet long and [latex]20[/latex] feet wide, needs to be fenced around all four sides. How many feet of fencing is required? (To keep it simple, ignore any gates or other complications.)
- Giancarlo is putting crown molding around the edge of the ceiling of his living room. If the room is a [latex]12[/latex]-foot by [latex]16[/latex]-foot rectangle, how much crown molding does he need?
The sides of a regular polygon are all equal in length. Therefore, multiplying the length of a side by the number of sides will give us the perimeter.
Perimeter Formula
Regular Polygon with [latex]n[/latex] sides of length [latex]s[/latex]: [latex]P=n\cdot{s}[/latex]
Practice Exercises
Find the perimeter of each regular polygon.
- Each side of the hexagon is [latex]4[/latex] inches long.
- Each side of the octagon is [latex]2.5[/latex] centimeters long.
Examples: Perimeter
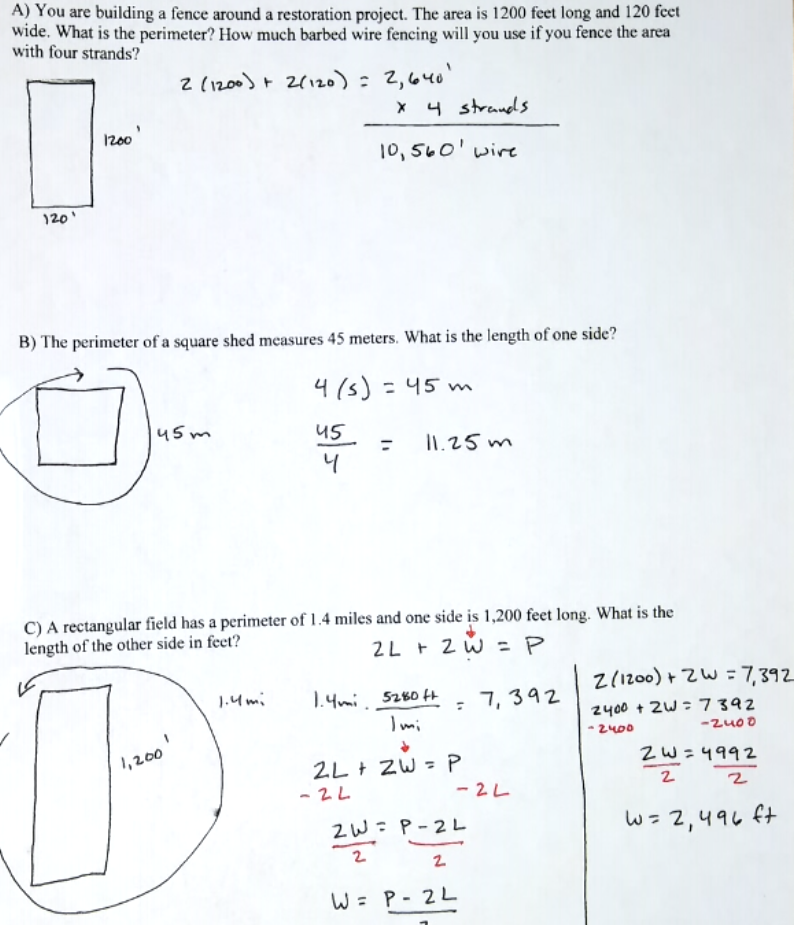
A) You are building a fence around a restoration project. The area is 1200 feet long and 120 feet wide. What is the perimeter? How much barbed wire fencing will you use if you fence the area with four strands?
B) The perimeter of a square shed measures 45 meters. What is the length of one side?
C) A rectangular field has a perimeter of 1.4 miles and one side is 1,200 feet long. What is the length of the other side in feet?
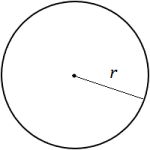
The distance around the outside of a circle is called the circumference, rather than the perimeter. Let's review some circle vocabulary before moving on.
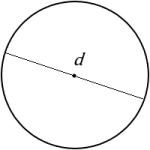
Every point on a circle is the same distance from its center. This distance from the center to the edge of the circle is called the radius. The distance from one edge to another, through the center of the circle, is called the diameter. As you can see, the diameter is twice the length of the radius.
Throughout history, different civilizations have discovered that the circumference of a circle is slightly more than [latex]3[/latex] times the length of its diameter. (By the year 2000 BCE, the Babylonians were using the value [latex]3\frac{1}{8}=3.125[/latex] and the Egyptians were using the value [latex]3\frac{13}{81}\approx3.1605[/latex].)[1] The value [latex]3\frac{1}{7}\approx3.1429[/latex] is an even better approximation for the ratio of the circumference to the diameter. However, the actual value cannot be written as an exact fraction; it is the irrational number [latex]\pi[/latex], pronounced "pie", which is approximately [latex]3.1416[/latex].
Circumference Formulas
[latex]C=\pi{d}[/latex]
[latex]C=2\pi{r}[/latex]
Any scientific calculator will have a [latex]\pi[/latex] key; using this will give you the most accurate result, although you should be sure to round your answer appropriately. (Remember from that we need to pay attention to significant figures when multiplying or dividing.) Many people use [latex]3.14[/latex] as an approximation for [latex]\pi[/latex], but this can lead to round-off error. If you must use an approximation for [latex]\pi[/latex], use [latex]3.1416[/latex].
Practice Exercises
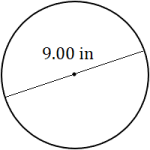
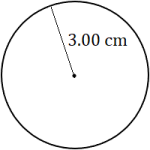
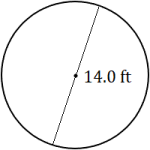
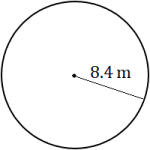
Calculate the circumference of each circle. Round each answer to the appropriate level of accuracy.
Examples: Circumference
A) If the radius of a circle is 12 feet, what is the diameter? What is the circumference?
B) You need to insulate the circumference of a grain bin where it meets the concrete pad. The diameter of the cylindrical bin is 8 meters. What length of insulation will you need?
C) The circumference of a tree is 42 inches. What is its diameter?
Problem Set 7.1
1. A large soccer field measures 110 meters by 75 meters. What is its perimeter?
2. You are building a small enclosure for beaver that you trapped to relocate. The area is 150 feet long and 25 feet wide. What is the perimeter? If galvanized wire fencing is sold in 100-foot rolls, and costs $159/roll. How much will fencing cost for the project?
3. The perimeter of a square box measures 84 inches. What is the length of one side?
4. A pasture has a perimeter of 1 mile and one side is 2,000 feet long. What is the length of the other side in feet?
5. A circular watering trough has a radius of 5 feet. What is the diameter? What is the circumference?
6. The circumference of a tree is 68 inches. What is its diameter?
7. You're moving goats into a sensitive area of your national park for weed control. A historic oak tree is in this area and you need to protect it from the goats with fencing. The oak has a diameter of 58 inches. You want the circular fence to sit a foot away from the tree in all directions. How many feet of fencing will you need to protect this oak?
- This information comes from Chapter 1 of the book A History of Pi by Petr Beckmann. It is a surprisingly interesting read. ↵
Applications
What do technicians in our fields do? Well - much of the time we are sampling from a larger population to make inferences about that population. We might be sampling from a population of Ponderosa pine (Pinus ponderosa), a population of Bull Trout (Salvelinus confluentus), or a population of streams within a watershed.
Understanding the relationship between a population and samples we take from it (and the mathematical symbols we use when working with samples) will help you navigate this short section on statistics.

Objectives
When you've finished this chapter, you'll be able to describe the relationship between a population and samples taken from it and to use symbols to describe these.
The Bull River Guard Station was built in 1908 as the Ranger's house and office. This structure was a primary ranger station from 1908 to 1920, surviving the 1910 fire. The cabin was home to Granville "Granny" Gordon (District Ranger), his wife and three daughters. When the 1910 fires roared thru the country, Mrs. Gordon prepared for the worst by soaking gunny sacks in a tub of water. If they had to escape the fire, they would wrap themselves in the gunny sacks and race to the Bull River to wait out the fire. As the fire closed in on the ranger station, it shifted direction and swept up Pilik ridge sparing their home. The cabin is a two story building, containing 700 square feet.
Applications
Back to our Bull Trout! Let's pull two samples of five fish from two different populations, one in the Bull River and the other population in the Clark Fork River.
| Bull River | Bull River | Clark Fork River | Clark Fork River |
| 63 mm | 55 mm | 980 mm | 830 mm |
| 72 mm | 75 mm | 35 mm | 22 mm |
| 75 mm | 67 mm | 46 mm | 30 mm |
| 67 mm | 59mm | 25 mm | 21 mm |
| 59 mm | 81 mm | 40 mm | 21 mm |
What is the mean of each sample? Do you feel like this adequately describes the sample? What is different about samples from these two populations? How can we communicate this difference?
Objectives
When you've finished this chapter, you'll be able to describe variance and standard deviation in simple terms. You'll also be able to set up a spreadsheet to calculate these measures.
Applications
As long as we have Bull Trout (Salvelinus confluentus) on our minds...
We're sampling Bull Trout in the Bull River watershed. Let's say we electrofish, collect, and measure 240 fish. We have total length in millimeters and weight in grams for each fish. What do we do with this data next? What would you want to know? What might biologists managing this species want to know?
Objectives
When you've finished this chapter, you'll be able to accomplish the following:
- Differentiate among mean, median and mode.
- Select the best measurement for your data and purposes.
- Calculate and report mean, median, and mode for data in a spreadsheet.
Applications
Back to our Bull Trout! Let's pull two samples of five fish from two different populations, one in the Bull River and the other population in the Clark Fork River.
| Bull River | Bull River | Clark Fork River | Clark Fork River | |
| 225 | 301 | 980 | 1023 | |
| 335 | 175 | 35 | 22 | |
| 220 | 208 | 23 | 30 | |
| 130 | 306 | 25 | 21 | |
| 154 | 108 | 40 | 21 | |
| mean | 212.8 | 219.6 | 220.6 | 223.4 |
What is the mean of each sample? Do you feel like this adequately describes the sample? What is different about samples from these two populations? How can we communicate this difference?
Normal Distributions & Standard Deviation
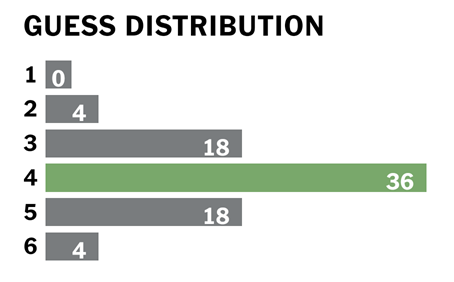
A normal distribution, often referred to as a bell curve, is symmetrical on the left and right, with the mean, median, and mode being the value in the center. There are lots of data values near the center, then fewer and fewer as the values get further from the center. A normal distribution describes the data in many real-world situations.
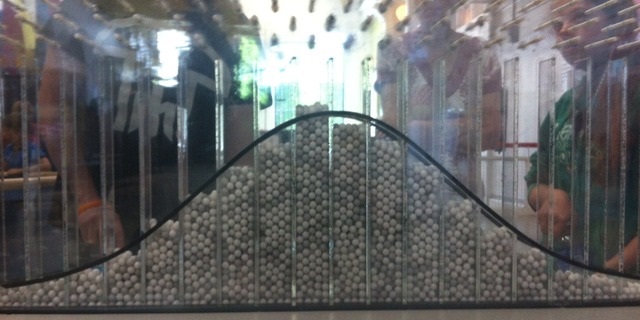
One of the best ways to demonstrate the normal distribution is to drop balls through a board of evenly spaced pegs, as shown here. (The Plinko game on The Price Is Right is a well known example of this.) Each time a ball hits a peg, it has a fifty-fifty chance of going left or right. For most balls, the number of lefts and rights are roughly equal, and the ball lands near the center. Only a few balls have an extremely lopsided number of lefts and rights, so there are not many balls at either end. As you can see, the distribution is not perfect, but it is approximated by the normal curve drawn on the glass.
The standard deviation is a measure of the spread of the data: data with lots of results close to the mean has a smaller standard deviation, and data with results spaced further from the mean has a larger standard deviation. The standard deviation is a measuring stick for a particular set of data.
The 68-95-99.7 Rule
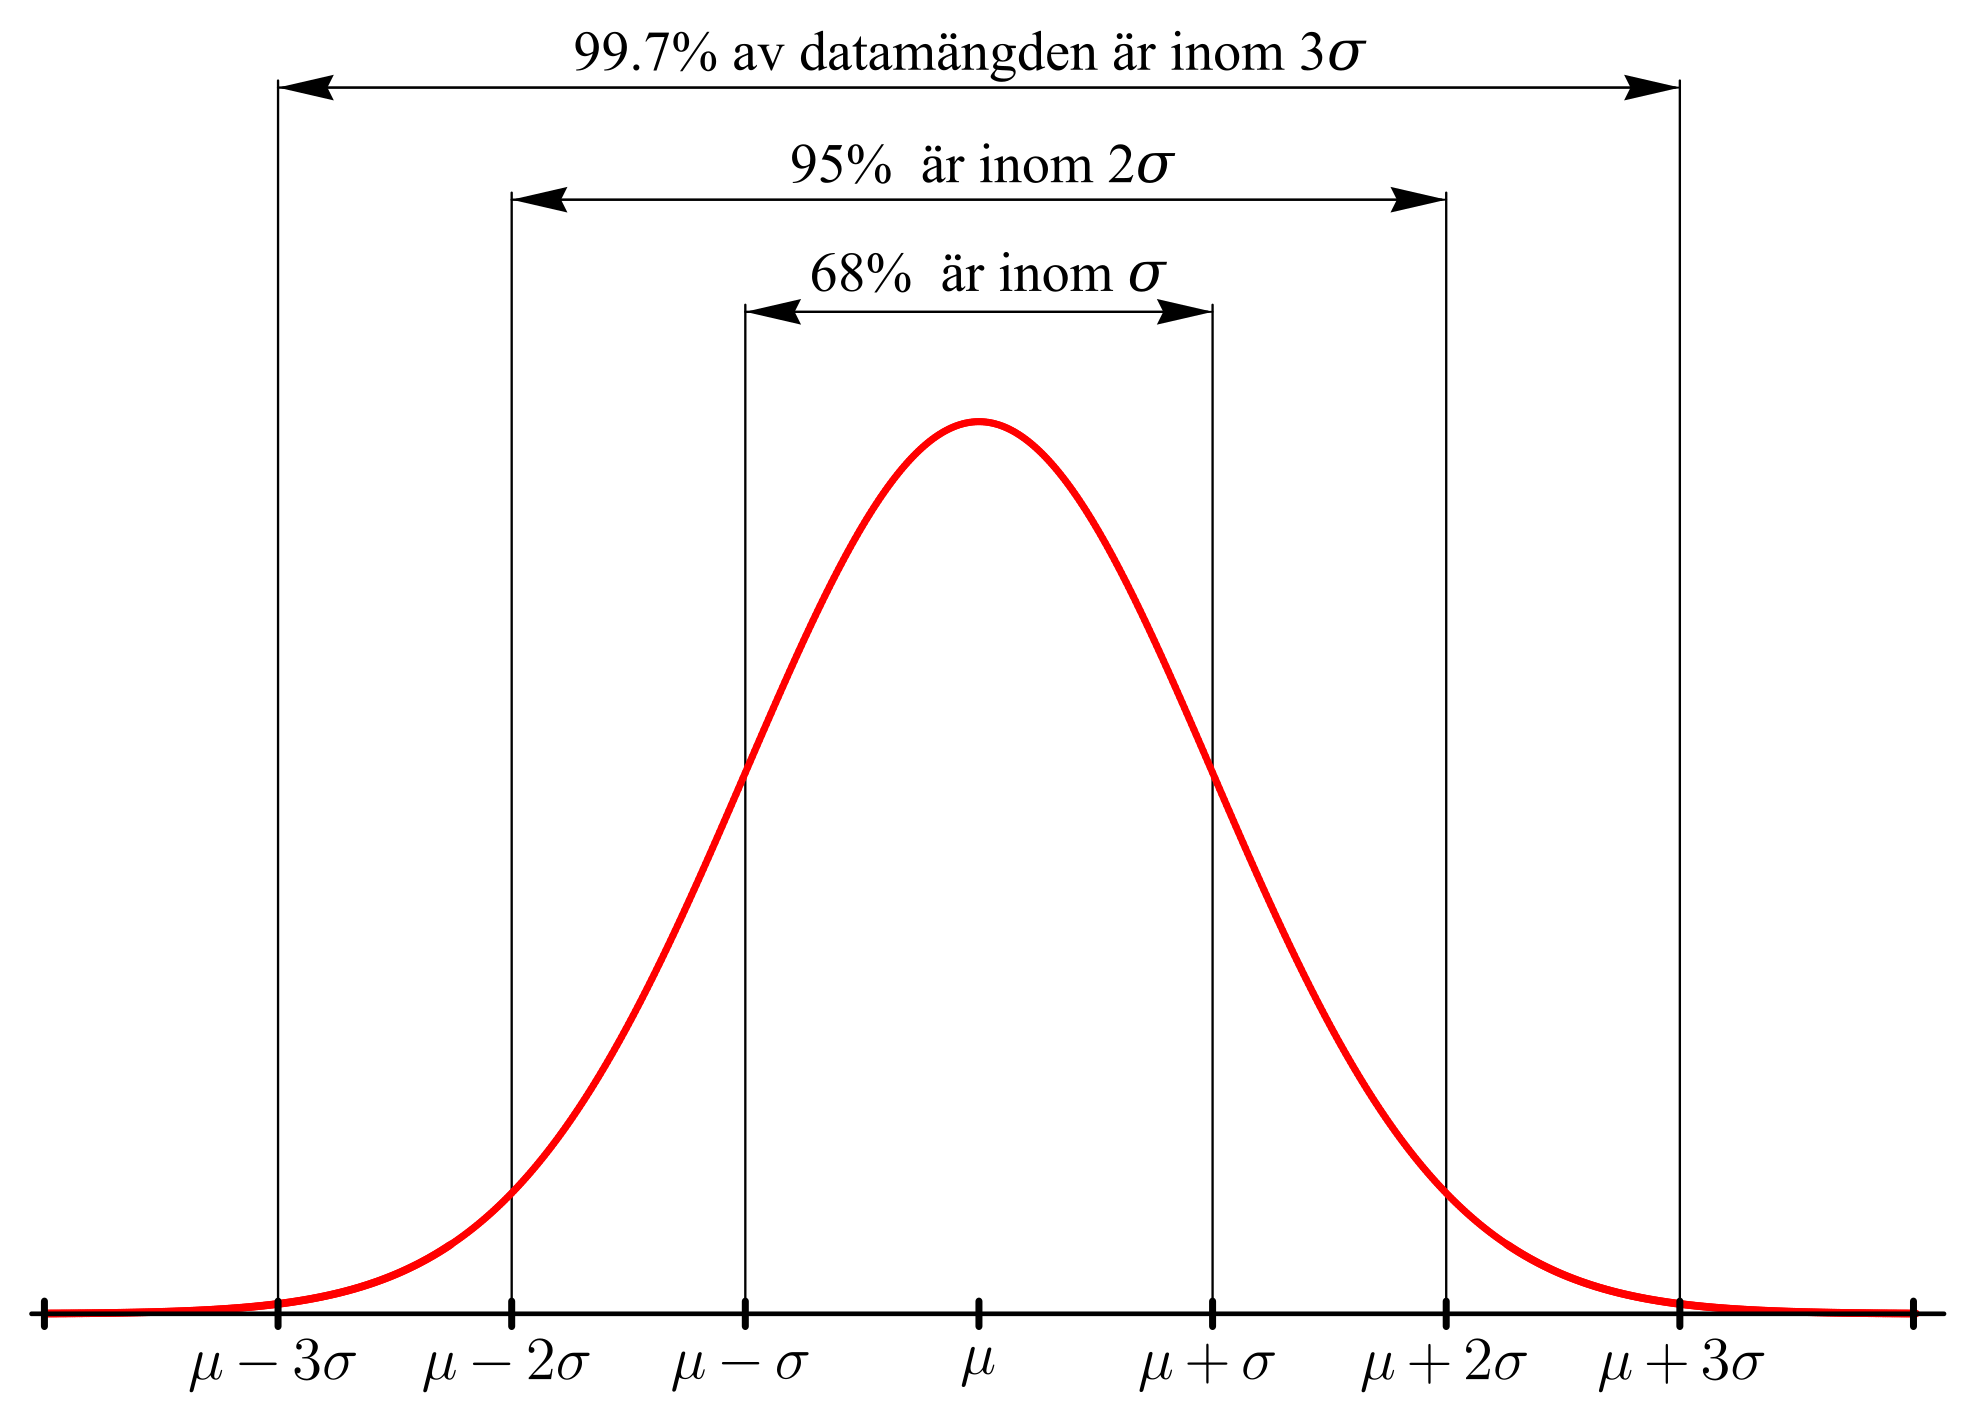
The 68-95-99.7 rule: In a normal distribution, approximately...
- [latex]68\%[/latex] of the numbers are within [latex]1[/latex] standard deviation above or below the mean
- [latex]95\%[/latex] of the numbers are within [latex]2[/latex] standard deviations above or below the mean
- [latex]99.7\%[/latex] of the numbers are within [latex]3[/latex] standard deviations above or below the mean
This is an empirical rule because it is based on observation of how the world works, rather than being based on a formula.[1]
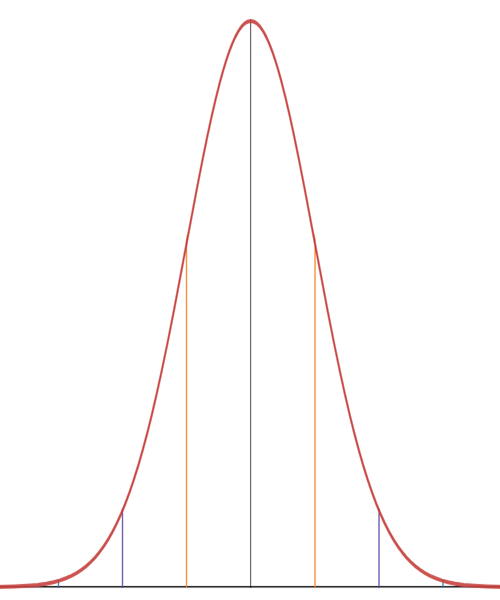
Returning to the ball-dropping experiment, let's assume that the standard deviation is three columns wide.[2] In the picture below, the green line marks the center of the distribution.
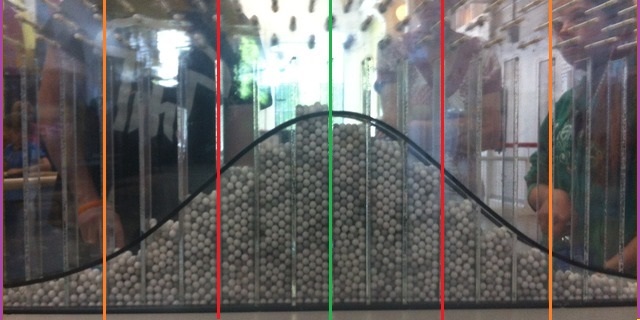
First, the two red lines are each three columns away from the center, which is one standard deviation above and below the center, so about 68% of the balls will land between the red lines.
Next, the two orange lines are another three columns farther away from the center, which is six columns or two standard deviations above and below the center, so about 95% of the balls will land between the orange lines.
And finally, the two purple lines are another three columns farther away from the center, which is nine columns or three standard deviations above and below the center, so about 99.7% of the balls will land between the purple lines. We can expect that [latex]997[latex] out of [latex]1,000[latex] balls will land between the purple lines, leaving only [latex]3[latex] out of [latex]1,000[latex] landing beyond the purple lines on either end.
Okay, that was a lot of information. For our purposes, the following restatement of the 68-95-99.7 rule may be more practical.
- [latex]68\%[/latex] of the numbers are between [latex]\mu-\sigma[/latex] and [latex]\mu+\sigma[/latex]
- [latex]95\%[/latex] of the numbers are between [latex]\mu-2\sigma[/latex] and [latex]\mu+2\sigma[/latex]
- [latex]99.7\%[/latex] of the numbers are between [latex]\mu-3\sigma[/latex] and [latex]\mu+3\sigma[/latex]
Practice Exercises
The heights of U.S. females are normally distributed. The average height is around [latex]63.5[/latex] inches ([latex]5[/latex] ft [latex]3.5[/latex] in) and the standard deviation is [latex]3[/latex] inches. Use the 68-95-99.7 rule to fill in the blanks.
- About [latex]68\%[/latex] of the women should be between _______ and _______ inches tall.
- About [latex]95\%[/latex] of the women should be between _______ and _______ inches tall.
- About [latex]99.7\%[/latex] of the women should be between _______ and _______ inches tall.
The heights of U.S. males are normally distributed. The average height is around [latex]69.5[latex] inches ([latex]5[latex] ft [latex]9.5[latex] in) and the standard deviation is [latex]3[latex] inches. Use the 68-95-99.7 rule to fill in the blanks.
- About [latex]68\%[/latex] of the men should be between _______ and _______ inches tall.
- About [latex]95\%[/latex] of the men should be between _______ and _______ inches tall.
- About [latex]99.7\%[/latex] of the men should be between _______ and _______ inches tall.
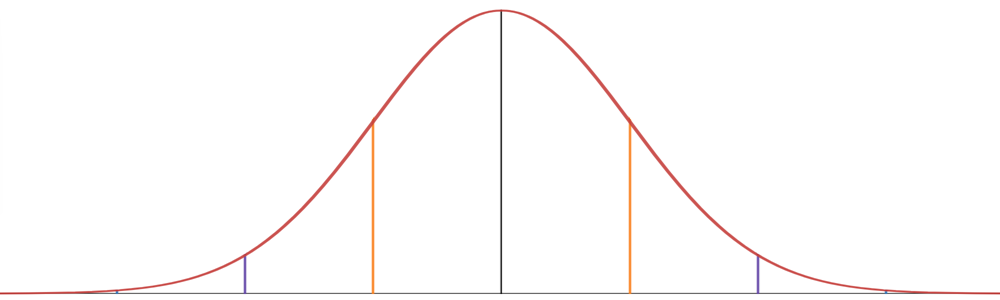
This graph provides another way to think about the distribution of the data.
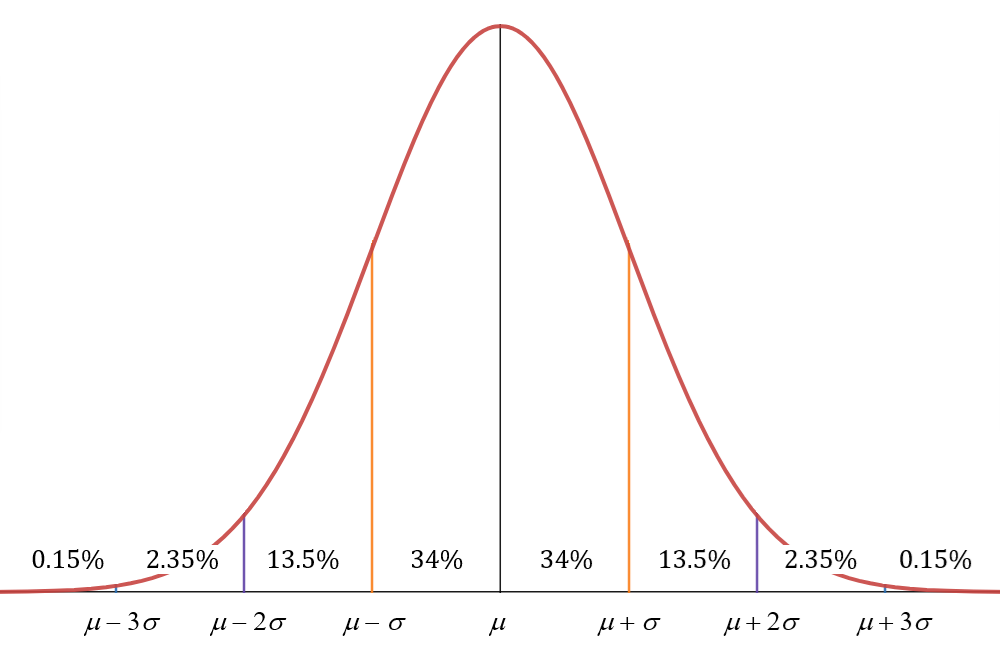
Because [latex]68\%[/latex] of the data are within one standard deviation of the mean, we have [latex]34\%[latex] of the data slightly below the mean and [latex]34\%[latex] slightly above. Moving outwards one more standard deviation in each direction, we have another [latex]13.5\%[latex] below the mean and another [latex]13.5\%[latex] above the mean, encompassing a total of [latex]95\%[latex] of the data. Moving outwards one more standard deviation, we have another [latex]2.35\%[latex] far below the mean and another [latex]2.35\%[latex] far above the mean, bringing the total up to [latex]99.7\%[latex] of the data. This leaves only [latex]0.15\%[latex] of the data more than three standard deviations below the mean and [latex]0.15\%[latex] of the data more than three standard deviations above the mean.
Practice Exercises
- What percent of U.S. males weigh between [latex]160[/latex] lb and [latex]230[/latex] lb?
- What is the average weight? (Hint: think about symmetry.)
- What is the standard deviation? (Hint: You have to work backwards to figure this out, but the math isn't complicated.)
- Based on the empirical rule, about [latex]95\%[/latex] of the men should weigh between _______ and _______ pounds.
This version of the graph can help us group the data into general categories. This is not official terminology, but hopefully it gets the point across.
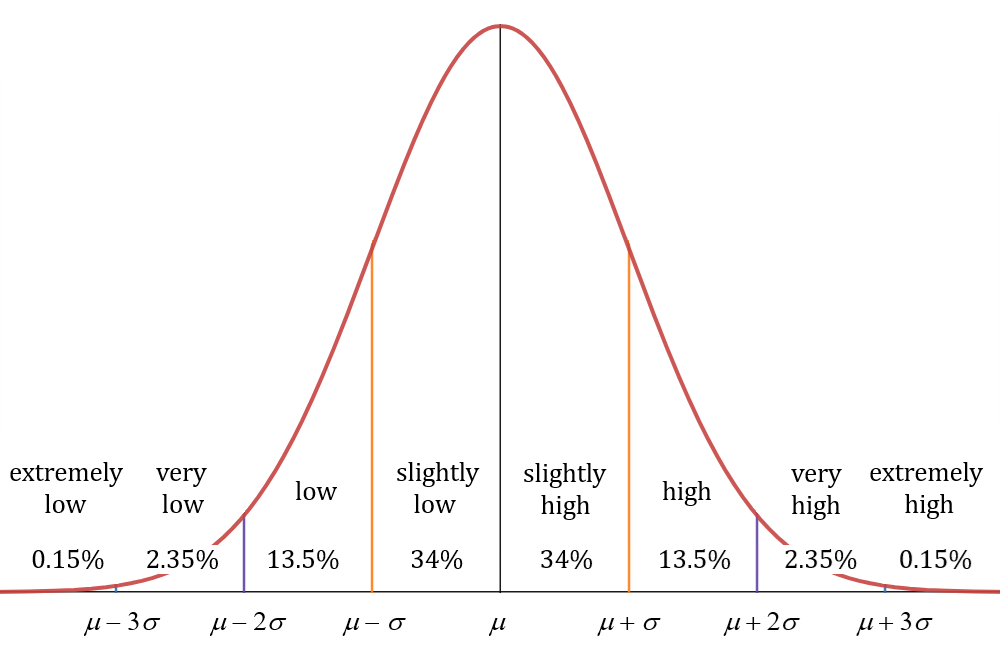
Looking at the middle [latex]68\%[/latex] of the data, [latex]34\%[/latex] could be considered "slightly low" and [latex]34\%[/latex] could be considered "slightly high". Moving outwards, we have another [latex]13.5\%[/latex] that could be considered "low" and another [latex]13.5\%[/latex] could be considered "high". Moving outwards again, we have another [latex]2.35\%[/latex] that could be considered "very low" and another [latex]2.35\%[/latex] that could be considered "very high". Finally, [latex]0.15\%[/latex] of the data could be considered "extremely low" and [latex]0.15\%[/latex] could be considered "extremely high".
We can find the standard deviation of a data set using the formula below. To summarize the formula, the standard deviation is the square root of the average difference of each number in the data set from the mean of that data set. Let's take a look at how that is calculated in the examples below.

 |
= | population standard deviation |
 |
= | the size of the population |
 |
= | each value from the population |
 |
= | the population mean |
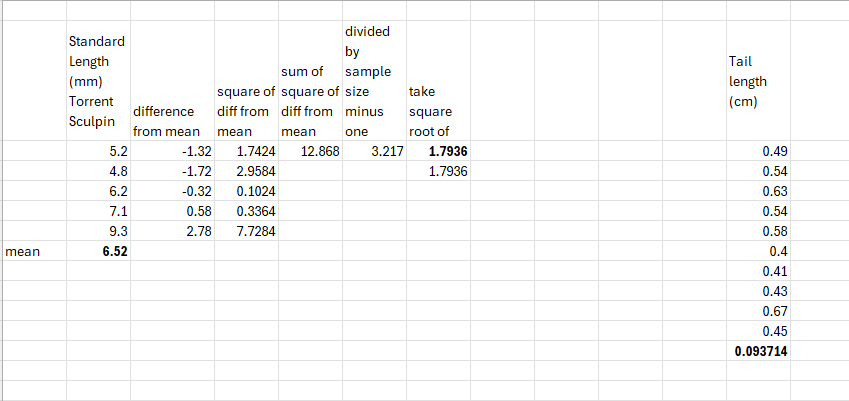
Examples: Calculating the standard deviation
A) Find the standard deviation by hand.
| Standard Length (cm) Torrent Sculpin
5.2 |
|
| 4.8 | |
| 6.2 | |
| 7.1 | |
| 9.3 | |
B) Use Excel to perform the standard deviation calculations.
| Tail length (cm) |
| 0.49 |
| 0.54 |
| 0.63 |
| 0.54 |
| 0.58 |
| 0.40 |
| 0.41 |
| 0.43 |
| 0.67 |
| 0.45 |
If you are asked only one question about the empirical rule instead of three in a row ([latex]68\%[/latex], [latex]95\%[/latex], [latex]99.7\%[/latex]), you will most likely be asked about the [latex]95\%[/latex]. This is related to the "[latex]95\%[/latex] confidence interval" that is often mentioned in relation to statistics. For example, the margin of error for a poll is usually close to two standard deviations.[4]
Let's finish up by comparing the performance of three NFL teams at the beginning of this century.
Practice Exercises
The numbers of regular-season games won by the New England Patriots[5] each NFL season from 2001-2019: [latex]11[/latex], [latex]9[/latex], [latex]14[/latex], [latex]14[/latex], [latex]10[/latex], [latex]12[/latex], [latex]16[/latex], [latex]11[/latex], [latex]10[/latex], [latex]14[/latex], [latex]13[/latex], [latex]12[/latex], [latex]12[/latex], [latex]12[/latex], [latex]12[/latex], [latex]14[/latex], [latex]13[/latex], [latex]11[/latex], [latex]12[/latex].
The mean number of wins is [latex]12.2[/latex], and a spreadsheet tells us that the standard deviation is [latex]1.7[/latex] wins.
- There is a [latex]95\%[/latex] chance of the Patriots winning between _______ and _______ games in a season.
- In 2020, the Patriots won [latex]7[/latex] games. Could you have predicted that based on the data? How many standard deviations from the mean is this number of wins?
The numbers of regular-season games won by the Buffalo Bills[6] each NFL season from 2001-2019: [latex]3[/latex], [latex]8[/latex], [latex]6[/latex], [latex]9[/latex], [latex]5[/latex], [latex]7[/latex], [latex]7[/latex], [latex]7[/latex], [latex]6[/latex], [latex]4[/latex], [latex]6[/latex], [latex]6[/latex], [latex]6[/latex], [latex]9[/latex], [latex]8[/latex], [latex]7[/latex], [latex]9[/latex], [latex]6[/latex], [latex]10[/latex].
The mean number of wins is [latex]6.8[latex], and a spreadsheet tells us that the standard deviation is [latex]1.7[/latex] wins.
- There is a [latex]95\%[/latex] chance of the Bills winning between _______ and _______ games in a season.
- In 2020, the Bills won [latex]13[/latex] games. Could you have predicted that based on the data? How many standard deviations from the mean is this number of wins?
The numbers of regular-season games won by the Denver Broncos[7] each NFL season from 2001-2019: [latex]8[/latex], [latex]9[/latex], [latex]10[/latex], [latex]10[/latex], [latex]13[/latex], [latex]9[/latex], [latex]7[/latex], [latex]8[/latex], [latex]8[/latex], [latex]4[/latex], [latex]8[/latex], [latex]13[/latex], [latex]13[/latex], [latex]12[/latex], [latex]12[/latex], [latex]9[/latex], [latex]5[/latex], [latex]6[/latex], [latex]7[/latex].
The mean number of wins is [latex]9.1[latex], and a spreadsheet tells us that the standard deviation is [latex]2.6[/latex] wins.
- There is a [latex]95\%[/latex] chance of the Broncos winning between _______ and _______ games in a season.
- In 2020, the Broncos won [latex]5[/latex] games. Could you have predicted that based on the data? How many standard deviations from the mean is this number of wins?
Problem Set 9.2
1) Find the standard deviation.
| Length of 4th metatarsal (mm) |
| 10.2 |
| 12.4 |
| 11.1 |
| 10.5 |
2) Which data set has more variation?
| Selway (g) | North Fork (g) |
| 15 | 12 |
| 13 | 13 |
| 14 | 11 |
| 18 | 13 |
| 22 | 15 |
| 17 | 11 |
| 14 | 13 |
| 12 | 32 |
3) Think like a forester. Here are age data from plots in three different stands. Which stand likely grew on a site that was clear cut? How do you know? Use standard deviation to support your answer.
| Stand 1
79 |
Stand 2 | Stand 3
148 |
||
| 80 | 90 | 92 | ||
| 78 | 76 | 158 | ||
| 82 | 82 | 111 | ||
| 81 | 76 | 136 | ||
| 83 | 68 | 195 | ||
| 80 | 67 | 6 | ||
| 81 | 74 | 17 | ||
| 83 | 79 | 80 | ||
| 77 | 65 | 205 | ||
| 80 | 83 | 186 | ||
| 81 | 79 | 140 | ||
| 75 | 111 | 3 | ||
| 80 | 100 | 108 | ||
| 81 | 69 | 74 | ||
| 77 | 86 | 206 | ||
| 82 | 80 | 113 | ||
| 79 | 64 | 5 | ||
| 80 | 44 | 5 | ||
| 81 | 88 | 78 | ||
| 82 | 82 | 82 | ||
| 80 | 84 | 173 | ||
| 80 | 81 | 11 | ||
| 82 | 75 | 48 | ||
| 77 | 78 | 109 |
