24 Measures of Center
Learning Objectives
- Find mean, median, and mode by hand
- Identify shapes of distribution
The “center” of a set of data describes roughly where most or the middle data values lie. Discussions on “center” are ONLY dealing with quantitative (or numerical) data.
Find Mean, Median, and Mode by Hand
Mean (or average)
To find the mean of a set of data, we add all the data values and then divide the result by the number of data values.
**Note: The mean is can only be calculated for quantitative data values.
Examples: Find the mean of the five randomly selected numbers by hand.
Suppose the following data values are given for number of seeds from five different seed packets. What is the average or mean number of seeds in a bag?
25 seeds, 23 seeds, 34 seeds, 32 seeds, 26 seeds.
Solution:

Median
The median is computed using the following steps:
- Step 1: Write the data in order from smallest to largest.
- Step 2:
- If there are an odd number of data values, cross off numbers from each end until there is only one left. That is the median.
- If there are an even number of data values, cross of numbers from each end until there are two left. Their average is the median.
Examples: Find the median of the following data sets
Example 1.
82, 77, 90, 71, 62, 68
Step one: Order the data.
62, 68, 71, 77, 82, 90
Step two: Since there is an even number of data there is no single “middle” data value- so to compute the median, we compute the average of the middle TWO data values.
![]()

Example 2.
240, 208, 179, 201, 206,
Step one: Order the data.
179, 201, 206, 208, 240
Step two: Since there is an odd number of data there is one single “middle” data value- so the median is this middle value.
![]()
![]()
Mode
The mode is the value of the data set that occurs with the highest frequency. If more than one value of the data set that occurs with the highest frequency then they are all modes. The data has no mode if all the data values occur at the same frequency.
Notes:
- A frequency distribution table can be helpful tool to find the mode.
- The mode can be found for quantitative and qualitative data values. See the example below.
Examples. Find the mode(s) of the following data sets.
The following are three different situations where a group of friends is voting on their favorite protein.
Example 1.
chicken, fish, beef, beef, beef, fish, chicken
|
Main Dish |
Frequency |
|
Chicken |
2 |
|
Fish |
2 |
|
Beef |
4 |
Solution: Since the choice of beef appears 4 times (larger than chicken or fish), beef is the mode of this data set.
Example 2.
- Chicken, fish, fish, fish, beef, chicken, chicken, beef, chicken, fish
|
Main Dish |
Frequency |
|
Chicken |
4 |
|
Fish |
4 |
|
Beef |
2 |
Solution: Since the both chicken and fish appear 4 times (larger than beef), chicken AND fish are both the modes of this data set.
Example 3.
- Chicken, fish, fish, beef, chicken, beef
| Main Dish |
Frequency |
|
Chicken |
2 |
|
Fish |
2 |
|
Beef |
2 |
Solution: Since all choices appear the same number of times, there is no mode for this data set.
Identify Shapes of Distributions
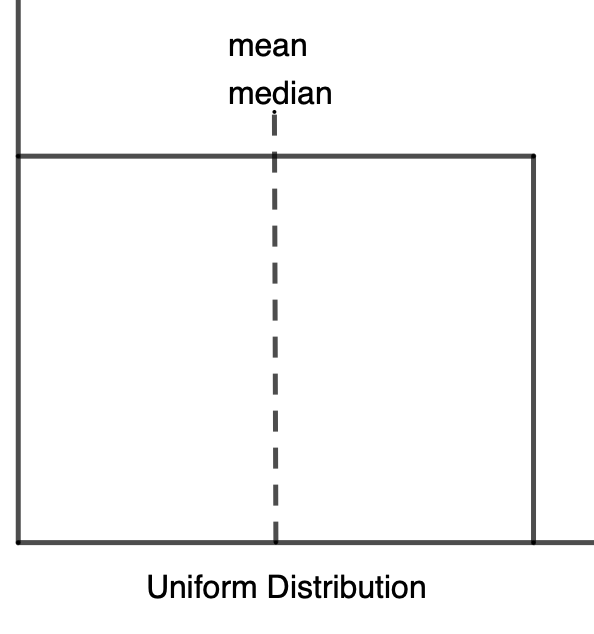
There are four main shapes of distributions we will consider: Skewed Right, Normal, Skewed Left, and Uniform (see images below). For each one, the relationship between the mean, median, and mode is different: Look at each graph and note the relationship between the median, mean and mode for each. These observations help to inform the spread or the data.
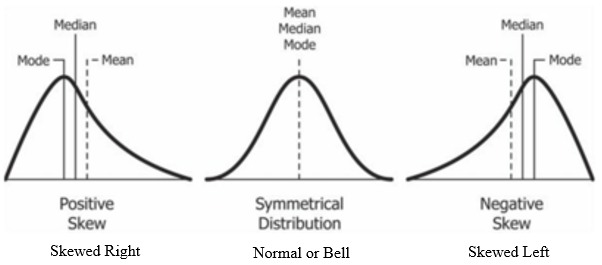
Image source: Diva Jain CC:BY-SA https://en.wikipedia.org/wiki/Skewness
Attributions
- Content and images adapted from “MATH 1420: Geometry Concepts for Teachers” by the RSCC Math 1410/1420 OER Team under Creative Commons Attributions 4.0 International License.
- Portions of this content adapted from ‘Math in Society Edition 2.5’ by David Lippman: Describing Data (http://www.opentextbookstore.com/mathinsociety/2.5/DescribingData.pdf).
