27 Percentiles, Quartiles, and Boxplots
Learning Objectives
- Find percentiles and Quartiles
- Draw boxplots
Finding Percentiles
Percentiles are a measure of the location of a percentage of data. For example, we write P30 to represent the 30th percentile and P30 is the value that separates the bottom 30% from the top 70% of a set of data. Percentiles deal with quantitative (or numerical) data only.
Steps for finding percentiles
Suppose you want to know what percentile a give data value is in a data set (that is, you want to find what percentage of the data is BELOW your given value). To find this percentile, you complete the following steps:
- Step 1: Put the data set in ascending order.
- Step 2: Count the number of data values below your given value (call this number M)
- Step 3: Count the total number of data values in your data set (call this number N)
- Step 4: The percentile of your given value is M/N.
Examples: Computing Percentiles
A class took an exam. The exam scores are listed below. Find the following percentiles for the exam score listed.

- What percentile is a score of 67?
Solution: First, we must organize the data from smallest to largest:
27, 37, 44, 54, 64, 66, 67, 74, 75, 76, 77, 79, 80, 86, 88, 89, 89, 90, 100, 100
The score of 67 is the 6th score in the list our of 20 total scores. This means that 67 is [latex]\frac{6}{20}[/latex] in the total list. To make this a percentage (i.e., to find the percentile) we multiply by 100. [latex]\frac{6}{20}*100 = 30[/latex]
Answer: 67 is the 30th percentile
2. What percentile is a score of 86?
Solution: Here we see that the score of 86 is the 13th score in the ordered data. This means that the score of 86 is at the [latex]\frac{13}{20}*100 = 65[/latex] percentile.
3. What percentile is a score of 86?
Solution: Here we see that the score of 76 is the 9th score in the ordered data. This means that the score of 86 is at the [latex]\frac{9}{20}*100 = 45[/latex] percentile.
Quartiles
Quartiles are special percentiles. The first quartile, [latex]Q_1[/latex], is the same as the 25th percentile, and the third quartile, [latex]Q_3[/latex], is the same as the 75th percentile. The median is called both the second quartile, [latex]Q_2[/latex], and the 50th percentile.
Steps for finding the quartiles ([latex]Q_1[/latex], [latex]Q_2[/latex], [latex]Q_3[/latex])
- Step 1: Put the data set in order from smallest to largest.
- Step 2: Find the median. This is [latex]Q_2[/latex]!
- Step 3: Find the median of the bottom half of the data (this is [latex]Q_1[/latex])!
- Step 4: Find the median of the top half of the data (this is [latex]Q_3[/latex])!
Examples: Find [latex]Q_1[/latex], [latex]Q_2/latex], and [latex]Q_3[/latex] for a set of data.
The set of data are scores from a recent course exam.

Solution: Similar to finding percentiles, we first must put the data in order from smallest to largest:
27, 37, 44, 54, 64, 66, 67, 74, 75, 76, 77, 79, 80, 86, 88, 89, 89, 90, 100, 100
Finding [latex]Q_2[/latex]:
To find [latex]Q_2[/latex] (or the median), we need to find the middle value (or the value that occurs 50% of the way through the data). Since we have an even number of data values, we see that two exam scores (76 and 77) occur in the middle. This means, that Q_2 is the average of these two data values:

Finding [latex]Q_1[/latex] (or 25 percentile):
Now, to find Q_1, we only look at the lower half of the data and find the middle (or median) of this data set. The low half of exam scores are:
27, 37, 44, 54, 64, 66, 67, 74, 75, 76
We see that there are two values in the middle of this set of data: 64 and 66. So the Q_1 is the average of these two scores:

Finding [latex]Q_3[/latex] (or 75 percentile):
Now, to find Q_3, we only look at the upper half of the data and find the middle (or median) of this set of data. The top half of exam scores are:
77, 79, 80, 86, 88, 89, 89, 90, 100, 100
We see again that there are two values in the middle of this set of data: 88 and 89. So the Q_3 is the average of these two scores:

Find the following quartiles for the data set.
8, 16, 25, 38, 44, 33, 12, 34, 66, 55, 15, 22, 43, 5, 22
![]()
5, 8, 12, 15, 16, 22, 22, 25, 33, 34, 38, 43, 44, 55, 66
After ordering our set, we see that the middle value (or median, or Q_2) is 25
![]()
5, 8, 12, 15, 16, 22, 22
We identify the first half of the data and pick out the middle number. The middle number of this list, or Q_1 is 15.
![]()
33, 34, 38, 43, 44, 55, 66
We identify the last half of the data and pick out the middle number. The middle number of this list, or Q_3 is 43.
Boxplot
A boxplot is a type of graph for quantitative data. To draw a boxplot, we first need to compute what is called a 5-number summary.
For a set of data, the 5-number summary consists of these five values:

Examples. Finding the 5-number summary,
Find the following 5-number summary for the class data set.

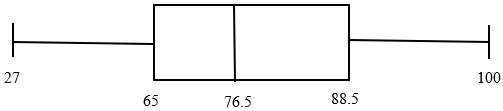
Answer: The 5-number summary is (27, 65, 76.5, 88.5, 100)
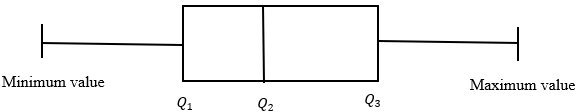
Drawing boxplots
Boxplots are created by drawing the following on top of a number line in which the values drawn are above the values from the 5-number summary. Note that sometimes we instead of using the minimum and maximum values for the ends (or whiskers) of the boxplot, we use the max and min values that are not outliers. We will not cover this in the scope of our course.
Examples. Drawing Boxplots
Draw a boxplot for the class data set.

Attributions
- Content and images adapted from "MATH 1420: Geometry Concepts for Teachers" by the RSCC Math 1410/1420 OER Team under Creative Commons Attributions 4.0 International License.
