4 Exponential Growth Models
Learn by watching
The links below will launch the video lessons in YouTube
- Constant Percentage Rate of Change (5 minutes 4 seconds)
- Exponential Growth Models when Rate of Change is Known (10 minutes 51 seconds)
Try Exercises #1-4.
The links below will launch the video lessons in YouTube
- The Algebra behind Solving an Exponential Equation for “r” (6 minutes 40 seconds)
- Exponential Growth Models when Rate of Change is NOT known (10 minutes 28 seconds)
Try Exercises #5-8.
learn by reading
Like linear growth models, the rate of change (given in terms of 1 unit of increase) is a key characteristic of an exponential growth model. Unlike linear growth models (where the rate of change is a constant, set number), an exponential growth model has a rate of change that is a constant, set percentage. Here are some examples of constant percentage rates of change that you may have come across:
- The rate of inflation in the US is typically 3.8% per year.
- The global (world) population is currently growing at a rate of 0.88% per year.
- The average rate of a car’s depreciation (how your car value decreases over time) is about 20% per year.
- If you miss a payment on your credit card, some companies will raise your APR (annual percentage rate) on future billing statements. These penalty rates can be as high as 29.9% per year.
Using RATES of change to write EXPONENTIAL equation models
Similar to linear equation models, we can uniquely make an exponential equation model as long as we have a starting value and a rate of change (remember with linear models, that rate of change is a number, while with exponential models, the rate of change is a percentage.) With exponential models, however, our starting equation form looks a little bit different:
GENERAL EXPONENTIAL EQUATION MODEL
REMINDER: Changing Percentages into Decimal Form
You can change any percentage into its decimal form by dividing by 100.
- 38% = 38/100 = 0.38
Another approach is to move the decimal TWO places to the left. (Recall that if there is no decimal point in the percentage, then the decimal point is at the end of the number)
- 38% = 38.0% = 0.38 <– moving the decimal two place to the left passes in front of the 8 (one place) and then in front of the 3 (two places).
Here are some additional examples:
- 5% = 5/100 = 0.05 [notice in moving the decimal 2 places to the left, there is nothing in front of the 5 for that second move, so we need to add in a zero as a placeholder]
- 125% = 125/100 = 1.25 [if your percentage growth rate is over 100%, then your decimal form will be greater than 1]
- 0.88% = 0.88/100 = 0.0088 [notice our percentage starts with the decimal out front; so when we move it 2 places to the left, we need to add in two zeroes as placeholders]
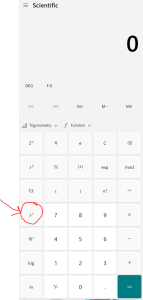
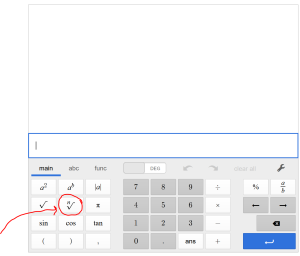
TECHNOLOGY TIP: Entering Exponents on a Scientific Calculator
FOR ALL FUTURE TECHNOLOGY TIPS AND SCREENSHOTS, I WILL ONLY BE USING THE DESMOS SCIENTIFIC CALCULATOR.
This is a free tecnhnology. You can access it on the web at http://www.desmos.com/scientific or you can search and download “desmos scientific calculator” on your phone’s app store. The interface will look the same on web and on mobile.
Example 1: In 2013, Netflix had 34.24 million subscribers and has been growing at a rate of 23.61% per year. Create an exponential growth model reflecting this rise in subscribers. Then use this growth model to predict the number of subscribers in 2030.
We have a known starting value (32.24 million subscribers in 2013), and we have a known percentage rate of change (23.61% each year). This is enough for us to write our equation for this situation.
n = number of years since 2013
P = number of Netflix subscribers (in millions of people)
a = starting value = 32.24
r = 23.61%, which is 0.2361 in decimal form
So putting our known values into the exponential equation P = a(1+r)n, we find that:
P = 32.24 (1 + 0.2361)n
Now we can use our Netflix subscriber growth model equation to plan and predict.
We want to find the number of subscribers in the year 2030. Our starting value was the year 2013. Since we need to know the number of years since 2013 to use for n in our formula, we can subtract: 2030 – 2013 = 17 years. So plugging 17 in for n in our equation, we can use our calculator to find:
P = 32.24 (1 + 0.2361)n = 32.24 (1 + 0.2361)17 = 1183.9
Example 2: In 1970, the Southern African lion population was about 36,000 lions. Due to habitat loss and increased hunting, the lion population has been decreasing at a rate of about 2.7% each year.[1] Create an exponential growth model reflecting the decline in the number of lions in Southern Africa. Then use your growth model to predict the number of lions in the year 2020.
We have a known starting value (36,000 lions in the year 1970), and we have a known percentage rate of change ( declining by 2.7% each year). This is enough for us to write our equation for this situation.
n = number of years since 1970
P = population of lions in Southern Africa
a = starting value = 36,000
r = -2.7%, which is -0.027 in decimal form [notice that we make our rate negative here to show that the population is decreasing rather than growing)
So putting our known values into the exponential equation P = a(1+r)n, we find that:
P = 36,000 (1 – .027)n
Now we can use our lion growth model equation to plan and predict.
We want to find the number of lions in the year 2020. Our starting value was the year 1970. Since we need to know the number of years since 1970 to use for n in our formula, we can subtract: 2020 – 1970 = 50 years. So plugging 50 in for n in our equation, we can use our calculator to find:
P = 36,000 (1 – 0.027)n = 36,000 (1 – 0.027)50 = 9,161
Exercises (Part 1): Try these!
For each of the following situations:
- label the units for your variables (n = ? and P = ?)
- write an exponential equation model of the form P = a(1+r)n to fit the situation
- use your equation model to answer the questions that follow (Be sure to show your work — if evaluating, write what you are typing into your calculator; if solving, show the steps to solve the equation).
1) Although the last few years have been unstable due to the pandemic and recession, the average inflation rate in the US is 3.8% per year. In 1960, a loaf of bread cost $0.23. Assuming average inflation, what would we expect a loaf of bread to cost in 2023?
2) The population of Seattle in 2022 was 3,489,000 in 2022 and is increasing at a rate of 0.86% per year. If growth continues at this rate, what would you expect the population of Seattle to be in the year 2030?
3) A 2022 Dodge Ram 1500 sold for $46,210 new, and historically depreciates 9.77% per year. What would you expect the value of the car to be in five years (the typical length for a car loan).
4) The Escherichia coli bacteria can grow at a rate of 3.5% per minute. Imagine you are working in a science lab. Assuming you start with a population of 100 bacteria, growing unrestrained, how many bacteria would you have after one hour?
writing EXPONENTIAL equation models when you don’t know the rate of change
If we want to write a exponential equation model (P = a(1+r)n), it is our responsibility to come up with the a and the r that fit our given situation. Sometimes, however, we are not given the percentage rate of change, r. In these cases, as long as we are given some pieces of information about a value other than the starting point, we can figure out the value of r to use. WARNING: because exponential increase changes over time (increases are small at first, then get bigger later), we CANNOT just find a percentage and divide it by the time. Finding the r value for an exponential equation will require a completely different approach. Let’s walk through the process.
Example 3: The median property value in Kirkland in January 2019 was approximately $780,000. By January 2022, Kirkland’s median home value had reached $1,200,000. [2] Assuming exponential growth, find the percentage growth rate per year for properties in Kirkland.
In this example, the first thing we are asked to find is the percentage growth rate for Kirkland properties. This isn’t given in the problem. However, I am given two data points:
In 2019, values were $780,000.
In 2022, values were $1,200,000.
Because we are using exponential growth, we are going to use our exponential growth formula model to help us find r. Remember that formula is P = a(1+r)n
Because 2019 is the oldest value, I am going to have my n = number of years since 2019, and P = median price of homes in Kirkland.
I can specify my a value to be the $780,000, because that is the price in 2019.
My general equation now looks like this: P = 780,000(1+r)n. I still don’t know r. But what I do know is another value. In 2022 (which is 3 years since 2019), home values reached $1,200,000. I can fill these values in for n and P, because this should be a point in my line.
1,200,000 = 780,000 (1+r)3
Now that r is the only variable in this equation, we are going to need algebra to solve it. Let’s go through this step by step. Because the “r” has three different numbers on the same side of the equation (the 780,000; the 1; and the 3), I am going to require three steps to solve the equation. It DOES matter the order you take care of this. Because we are ‘un-doing” the order of operations to solve the equation, we are going to get rid of the multiplication first, then the exponent, and lastly the value that is in the parentheses with the r.
To get rid of the multiplication, we are going to do the opposite operation and divide each side of the equation by 780,000.
(1,200,000)/780,000 = (780,000 (1+r)3)/780,000
1.5384 = (1+r)3
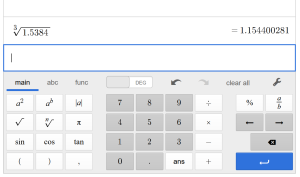
Next we want to get rid of the exponent. The opposite of an exponent is a root. In this case, to get rid of the 3rd power, we will want to take the 3rd root of each side
3rd root (1.5384) = 3rd root ((1+r)3)
1.1544 = 1 + r
Lastly we can get rid of the 1. It is being added to the r, so to get rid of it, we will subtract 1 from each side.
(1.1544) – 1 = (1+r) – 1
0.1544 = r
Now remember, r is the DECIMAL FORM of our percentage. If we want to provide the percentage rate of change, you’ll need to convert the decimal value to a percentage. We can do this by multiplying by 100, or by moving the decimal 2 places to the right.
r = 0.1544 = 15.44%. So over the time frame between 2019 and 2022, Kirkland housing was increasing at a rate of 15.44% per year.
TECHNOLOGY TIP: Using the Desmos scientific calculator to take an nth root
First, be sure that you locate the nth root function on the keypad.
Notice it is conveniently located below the exponent key — since it is how you “undo” an exponent. When you push the button, your screen should look like this:
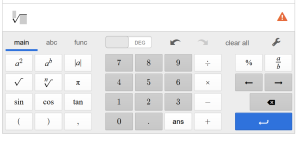
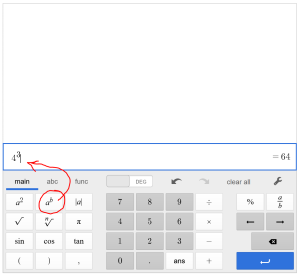
After you push the button, you’ll see something that looks like a square root, but has a smaller number on the top left. The cursor is sitting in this position waiting for your input. This is where you put which root you want. You always want the same root as the exponent you are trying to undo. Then you want to move the cursor inside the root to put what you are trying to take the nth root of. When you are done you can hit the blue arrow / enter key and your solution will show up on the right side of your screen.
Here I’ve typed in the 3rd root of 1.5384 (part of our solution process for Example 3), and then pressed enter:
Example 3a: Use the percentage growth rate you calculated in Example 3 to write an exponential equation model. Then predict the value of Kirkland homes in the year 2032 if the housing market continues growing at this rate.
In 2019, values were $780,000.
In 2022, values were $1,200,000.
Remember that an exponential equation model is of the form P = a(1+r)n
- Because 2019 is the oldest value, I am going to have my n = number of years since 2019, and P = median price of homes in Kirkland.
- I can specify my a value to be the $780,000, because that is the price in 2019.
- In Example 3, I found that my rate of housing price growth was 15.44% per year. Be sure to change that into decimal form when you put it in for r in your equation.
P = a(1+r)n becomes P = 780,000 (1 + 0.1544)n
And I’ve found my exponential equation model! Next we want to use this model to predict the housing prices in the year 2032.
Since n = number of years since 2019, then the n value for my prediction will be n = 2032 – 2019 = 13 years.
P = 780,000 (1 + 0.1544)n = 780,000 (1 + 0.1544)13 = $5,043,438.39
The median home value of Kirkland will reach $5,043,438.39 in the year 2032 assuming housing prices continue to grow as quickly as they did between 2019 and 2022.
Example 4: Suppose that you deposit $10,000 into a money market account. After leaving the investment (automatically reinvesting any interest you earned) alone for 8 years, your account balance is $14,000. Find the exponential growth rate of your investment account. How much money will be in your account if you leave it alone for an additional 8 years?
In this example, the first thing we are asked to find is the percentage growth rate for your account. This isn’t given in the problem. However, we are given two data points:
When we open the account, the balance was $10,000.
After 8 years, the account balance was $14,000.
Because we are using exponential growth, we are going to use our exponential growth formula model to help us find r. Remember that formula is P = a(1+r)n
Because we are given the opening account balance, we will just let n = number of years the account was opened, and let P = account balance (in dollars)
I can specify my a value to be the $10,000 because that is the price I deposited when I started the account.
My general equation now looks like this: P = 10,000(1+r)n. I still don’t know r. But what I do know is another value. Just 8 years after the account was opened, my account balance reached $14,000. I can fill these values in for n and P, because this should be a point in my line.
14,000 = 10,000 (1+r)8
Since r is now the only remaining variable in my equation, I can use algebra to solve for it. The 10,000, 1, and 8 are all numbers on the same side of the equation as the r, so it will take us three steps to get the r alone.
We start by dividing each side of the equation by 10,000.
(14,000)/10,000 = (10,000 (1+r)8)/10,000
1.4 = (1+r)8
Next, to get rid of the 8th power, I’m going to take the 8th root of each side.
8th root (1.4) = 8th root (1+r)8
1.043 = 1+r
Lastly subtract 1 from each side.
(1.043) – 1 = (1 +r) – 1
0.043 = r
Remember 0.043 is the decimal version of my rate, if I want to write it in percentage form, I want to multiply it by 100 (or move the decimal 2 places to the right). So r = 0.043 = 4.3% growth each year that my money remains in invested.
Now that I have found my r value, I can go back and write the general form of my exponential model for my investment account.
P = a(1+r)n
P = 10,000(1+0.043)n
Now I can use this equation to make plans and predictions. If I leave my money in the account for another 8 years, that will be a total of 16 years since I opened the account, so I can put n=16 into my formula.
P = 10,000(1+0.043)16 = 19,613.22
If I leave my money alone in the account for a total of 16 years, my account balance will be $19,613.22. (I will have almost doubled my initial $10,000 investment!)
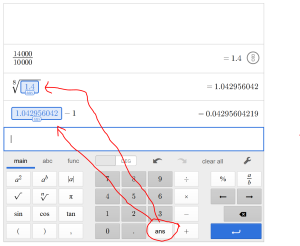
TECHNOLOGY TIP: Using the (ans) button in Desmos
If you recall, to solve this equation, we first divided each side by 10,000. Then took the 8th root of that answer. Then subtract one from that answer.
One of the nice things about Desmos is that you can see several lines of calculations. So if you just finished a calculation and want to use that answer in your next calculation you can hit the “ans” button. This function will automatically place whatever your last answer was into your new calculation.
CALCULATING AN UNKNOWN PERCENTAGE RATE OF CHANGE, r
- Divide each side of the equation by a.
- Take the nth root of each side of the equation.
- Subtract 1 from each side of the equation.
The resulting answer will be your rate in decimal form. If you want to write it as a percentage, you can multiply your solution by 100, or you can move the decimal point two places to the right. If you want to use r in your equation, then you will want to keep r in its decimal form.
Exercises (Part 2): Try these!
For each of the following situations:
- label the units for your variables (n = ? and P = ?)
- write an exponential equation model of the form P = a(1+r)n to fit the situation (Be sure to include the work you used to calculate r).
- use your equation model to answer the questions that follow (Be sure to show your work — if evaluating, write what you are typing into your calculator; if solving, show the steps to solve the equation).
5) In 1963, the bald eagle population hit an all-time low of 417 breeding pairs. After being labeled an Endangered Species, with its protected status, the eagle population grew to 9789 breeding pairs in 2007. At this point, the bald eagles were considered sufficiently recovered and have been removed from the Endangered Species list.
a) Assuming exponential growth, find the percentage growth rate while eagles were on the Endangered Species list.
b) Using your growth rate from part a, create an exponential equation model and how find many breeding pairs existed in the US in 2006. How many new breeding pairs were formed between 2006 and 2007?
6) In 2010, the world population was 6.97 billion people. In 2018, the world population was 7.662 billion people.
a) Assuming exponential growth, find the percentage growth rate of the world populations during this time period.
b) Using your growth rate from part a, create an exponential equation model and use your model to predict the world population in 2021.
7) In 2020, the world population was 7.821 billion people. In 2021, the population had grown to 7.888 billion.
a) Assuming exponential growth, find the percentage growth rate of the world populations during this time period.
b) Comparing to #6a, how much did the world’s growth rate change during the pandemic? Why might this be the case?
8) In 1990, Starbucks only had 84 stores. In the year 2000, Starbucks had 3501 stores. Assuming that Starbucks has been growing according to an exponential growth model, find a formula to describe the company’s growth.
a) If this trend continues, how many Starbucks stores are predicted to be open in the year 2019?
b) The actual number of stores in 2019 was only 31,795 stores. What reasons can you think of for why the exponential model might not be good at predicting so far into the future? What might be a better growth model to use in this situation?
