6 Logistic Growth Models
Learn by watching
The links below will launch the video lessons in YouTube
- Logistic Growth Model Formula (10 minutes 49 seconds)
- Logistic Growth Example (fish population) (9 minutes 52 seconds)
- Logistic Growth Example (blackberry population) (6 minutes 32 seconds)
Try Exercises #1-5.
learn by reading
A lot of things can be described by exponential growth — but only in the short term. The truth is, it is usually physically impossible for this type of ever-increasing growth to continue forever. In animal populations, if numbers increase too much, then the environment may not have enough food to support the growing population. In businesses, initial rapid growth for a successful company may look exponential, but eventually the company will have to deal with things like competition, supply issues, and environmental factors that may affect production. There also is this whole idea of “market saturation” — for example, cell phone plans may start with what looks like exponential growth, but eventually sales will slow as everyone has a cell phone; or, despite the rapid initial growth of Starbucks, we can’t keep up with that type of ever-increasing growth, or, in less than a century, we would end up with more stores than the much-slower-growing human population!
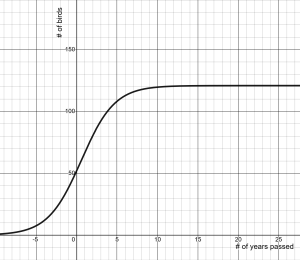
A better way to describe natural growth is called logistic growth. Recall that logistic graphs started with slow growth, increased in an exponential-type of way, but slowed down and eventually leveled off — like in this graph of a population of birds over time.
Like all growth models, the predictable type of behavior that we are seeing here can be described using a general formula.
Logistic Growth Models
[latex]P_n=P_{n-1}+r\left(1-\frac{P_{n-1}}{k}\right)\cdot P_{n-1}[/latex]
- Pn = the population at the time “n” that you want to know
- Pn-1 = the population at the time BEFORE the “n” that you want to know (i.e. the previous <year/month/day/second>’s population)
- r = percentage rate of change of growth (when there are no limiting factors) IN DECIMAL FORM
- k = carrying capacity within the given environment (or the upper maximum/limit that the population can realistically reach)
This strange-looking formula is an example of what we call a recursive equation. A recursive formula is one in which you have to use the answer from one calculation as part of the next calculation. Notice in this equation we have some things written as subscripts (values below the main level).
In the past, we have used values above the main level — these have been exponents, and those upper values are an important part of our calculation. However, when things are written below the main level, those subscripts are simply LABELS, and they are not part of our calculations. These subscripts are just a way to tell the difference between two populations– since we’d like to use the variable P for any population, the label gives us specific information about which of the two population we are looking at. So the label “n” in Pn means the population at a time I want to know, and the “n-1” in Pn-1 means the population at the time before that.
For example, suppose I wanted to know the population of birds in a forest in 4 years. I can’t just plug an “n=4” into my logistic growth formula and immediately find an answer (something we could do with linear and exponential formulas) . Logistic formulas don’t have a place for n. Instead, I have to know the starting population at time 0 years (P0), and then I can use that in my formula to calculate the population in year one (P1). When I know P1, I put that into the formula to help me find the population in the second year (P2). Once I’ve found P2, I can put that into the formula to help me find the population in the third year (P3). And then, once I know P3, I can finally use the formula to calculate the population in the fourth year (P4).
Notice that in the general logistic formula, the variable Pn-1 shows up THREE times in the equation. So you need to put that population you know (or have just calculated) into the equation all three times to find your next population value.
Example 1: Suppose you have 200 fish in a lake. Unrestrained, fish populations usually grow at a rate of 25% per year. However, the lake only has enough food and resources to support a total of 300 fish. How many fish will the lake have after 1 year? After 2 years? After 3 years?
We can tell from the example that this is will require using a logistic equation model. How do we know? We are given an unrestricted percentage growth rate, however, we are also given an upper limit/restriction for how much the environment can support.
Let’s identify the variables to use in our formula calculations: [latex]P_n=P_{n-1}+r\left(1-\frac{P_{n-1}}{k}\right)\cdot P_{n-1}[/latex]
r = percentage rate of change in decimal form = 25% = 0.25
k = the carrying capacity (upper limit) that the lake can support = 300 fish
To answer the first question, I want to find the population of the fish after 1 year. That is, I want to calculate P1. So in my formula, I’d need to use the starting population P0.
P0 = 200 fish
[latex]P_n=P_{n-1}+r\left(1-\frac{P_{n-1}}{k}\right)\cdot P_{n-1}[/latex]
[latex]P_1=P_{0}+r\left(1-\frac{P_{0}}{k}\right)\cdot P_{0}[/latex]
[latex]P_1=200+0.25\left(1-\frac{200}{300}\right)\cdot200=216.7[/latex]
So after 1 year, the population of fish in the lake is expected to be between 216 and 217 fish.
Now that we know that P1=216.7, we can use that in the formula to find P2.
[latex]P_2=P_{1}+r\left(1-\frac{P_{1}}{k}\right)\cdot P_{1}[/latex]
[latex]P_2=216.7+0.25\left(1-\frac{216.7}{300}\right)\cdot216.7=231.7[/latex]
So after 2 years, the population of fish in the lake is expected to be between 231 and 232 fish.
And now that we know P2=231.7, we can use that in the formula to find P3.
[latex]P_3=P_{2}+r\left(1-\frac{P_{2}}{k}\right)\cdot P_{2}[/latex]
[latex]P_3=231.7+0.25\left(1-\frac{231.7}{300}\right)\cdot231.7=244.9[/latex]
And after 3 years, the population of fish in the lake is expected to be about 245 fish.
Each time, we used the answer from the previous calculation THREE times in the new equation — replacing each of the Pn-1‘s.
Notice that how many new fish are in the lake is slowing down the closer we get to 300 fish. The first year, there were 16-17 new fish. In the second year, there were only 15 new fish. In the third year, there were only 13-14 new fish. This shows the increase is going slower as approach our 300-fish capacity.
Now, if our populations are growing REALLY fast, it IS possible to overshoot the “maximum” carrying capacity. Don’t worry! The way this model works, it will self-correct during the next cycle.
Example 2: The bacteria E. Coli reproduces very quickly — about 210% growth per hour. Suppose a science lab places 25 bacteria on an agar plate to study. The plate can only support 100 bacteria. How many bacteria will the plate hold after 3 hours?
We can tell from the example that this will require using a logistic equation model. How do we know? We are given an unrestricted percentage growth rate, however, we are also given an upper limit/restriction for how much the environment can support.
Let’s identify the variables to use in our formula calculations: [latex]P_n=P_{n-1}+r\left(1-\frac{P_{n-1}}{k}\right)\cdot P_{n-1}[/latex]
r = percentage rate of change in decimal form = 210% = 2.10
k = the carrying capacity (upper limit) that the plate can support = 100 bacteria
Although I want to find the number of bacteria after 3 hours, I only know the starting amount (P0). So I will have to use the logistic equation model formula 3 times (first find P1, then P2, and then finally the P3 I am looking for).
So let’s start by finding the population of the bacteria after 1 hour. That is, I want to calculate P1. So in my formula, I’d need to use the starting population P0.
P0 = 25 bacteria
[latex]P_n=P_{n-1}+r\left(1-\frac{P_{n-1}}{k}\right)\cdot P_{n-1}[/latex]
[latex]P_1=P_{0}+r\left(1-\frac{P_{0}}{k}\right)\cdot P_{0}[/latex]
[latex]P_1=25+2.1\left(1-\frac{25}{100}\right)\cdot25=64.4[/latex]
So after 1 hour, the population of bacteria on the agar plate is already between 64 and 65 bacteria.
Now that we know that P1=64.4, we can use that in the formula to find P2.
[latex]P_2=P_{1}+r\left(1-\frac{P_{1}}{k}\right)\cdot P_{1}[/latex]
[latex]P_2=64.4+2.1\left(1-\frac{64.4}{300}\right)\cdot64.4=112.5[/latex]
So after 2 hours, the population of bacteria on the agar plate is between 112 and 113 bacteria — which is more than the carrying capacity of the plate. So we’d expect some of these bacteria to die during the next growth cycle and put us closer to the environmental limit.
Finally we know P2=112.5, we can use that in the formula to find P3.
[latex]P_3=P_{2}+r\left(1-\frac{P_{2}}{k}\right)\cdot P_{2}[/latex]
[latex]P_3=112.5+0.25\left(1-\frac{112.5}{300}\right)\cdot112.5=82.9[/latex]
And we find that after 3 hours, the population of bacteria is expected to be about 83 bacteria.
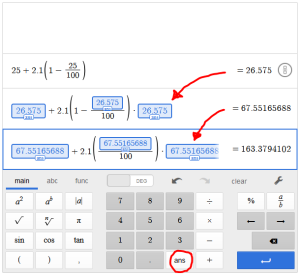
TECHNOLOGY TIP: Using the “ans” function on Desmos
The “ans” function on the calculator calls up the answer from the last calculation you typed, and then uses it in your next formula. It is the perfect way to simplify all the typing that needs to happen when using the recursive formula! You type in the first calculation, then when you go to do the second one, you substitute the “ans” function for all three places that use Pn in the logistic formula.
This is what the calculations for Example 2 look like using Desmos:
Exercises: Try these!
For each of the problems below, write a logistic equation to represent the described situation, then answer the question(s) that follow.
Recall, the general formula for Logistic Growth is: [latex]P_n=P_{n-1}+r\left(1-\frac{P_{n-1}}{k}\right)\cdot P_{n-1}[/latex]
- The amount of food placed daily into a biology lab enclosure can support no more than 200 fruit flies. A biologist released 35 flies into the enclosure. In an unrestrained environment, fruit flies grow at a rate of 39.25% per day. How many fruit flies will there be after 1 day? After 2 days? After 3 days?
- A certain national park is known to be capable of supporting no more than 300 black bears. Fifty-two bears are in the park presently. Unrestrained, the black bear population will grow 18% each year. How many bears will there be after 1 year? After 2 years? After 3 years?
- Rumors spread at the rate of 13% per hour. If 30 people start a rumor at a high school of 1500 students, how many students will know the rumor after 1 hour? After 2 hours? After 3 hours?
- Suppose you start stocking a fish pond with 50 fish. Unconstrained, the fish population will grow at a rate of 8% per year, however, the pond can only support 300 fish. What will be the population after 1 year? After 2 years? After 3 years?
- One dandelion can produce many seeds, leading to a high growth rate. A particular lawn currently has 24 dandelions. If dandelions can grow at a rate of 250% per month, but the carrying capacity of a lawn is only 130 dandelions, how many dandelions will the patch hold after 1 month? After 2 months? After 3 months?
