10 Climate Change: Temporal Scales
Climate Change in Earth History
For the past two centuries, climate has been relatively stable. People placed their farms and cities in locations that were in a favorable climate without thinking that the climate could change. But climate has changed throughout Earth history, and a stable climate is not the norm. In recent years, Earth’s climate has begun to change again. Most of this change is warming because of human activities that release greenhouse gases into the atmosphere. The effects of warming are already being seen and will become more extreme as temperature rise.
Climate has changed throughout Earth history. Much of the time Earth’s climate was hotter and more humid than it is today, but climate has also been colder, as when glaciers covered much more of the planet. The most recent ice ages were in the Pleistocene Epoch, between 1.8 million and 10,000 years ago. Glaciers advanced and retreated in cycles, known as glacial and interglacial periods. With so much of the world’s water bound into the ice, sea level was about 125 meters (395 feet) lower than it is today. Many scientists think that we are now in a warm, interglacial period that has lasted about 10,000 years.
For the past 2,000 years, climate has been relatively mild and stable when compared with much of Earth’s history. Why has climate stability been beneficial for human civilization? Stability has allowed the expansion of agriculture and the development of towns and cities.
Fairly small temperature changes can have major effects on global climate. The average global temperature during glacial periods was only about 5.5 °C (10 °F) less than Earth’s current average temperature. Temperatures during the interglacial periods were about 1.1 °C (2.0 °F) higher than today.
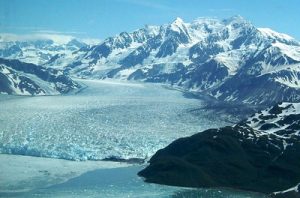
Since the end of the Pleistocene, the global average temperature has risen about 4°C (7° F). Glaciers are retreating and sea level is rising. While climate is getting steadily warmer, there have been a few more extreme warm and cool times in the last 10,000 years. Changes in climate have had effects on human civilization.
- The Medieval Warm Period from 900 to 1300 A.D. allowed Vikings to colonize Greenland and Great Britain to grow wine grapes.
- The Little Ice Age, from the 14th to 19th centuries, the Vikings were forced out of Greenland and humans had to plant crops further south.
Short-term: years to decades
Short-term changes in climate are common. The largest and most important of these is the oscillation between El Niño and La Niña conditions. This cycle is called the ENSO (El Niño southern oscillation). The ENSO drives changes in climate that are felt around the world about every two to seven years.
In a normal year, the trade winds blow across the Pacific Ocean near the equator from east to west (toward Asia). A low pressure cell rises above the western equatorial Pacific. Warm water in the western Pacific Ocean and raises sea levels by one-half meter. Along the western coast of South America, the Peru Current carries cold water northward, and then westward along the equator with the trade winds. Upwelling brings cold, nutrient-rich waters from the deep sea.
In an El Niño year, when water temperature reaches around 28 °C (82 °F), the trade winds weaken or reverse direction and blow east (toward South America). Warm water is dragged back across the Pacific Ocean and piles up off the west coast of South America. With warm, low-density water at the surface, upwelling stops. Without upwelling, nutrients are scarce and plankton populations decline. Since plankton form the base of the food web, fish cannot find food, and fish numbers decrease as well. All the animals that eat fish, including birds and humans, are affected by the decline in fish.
By altering atmospheric and oceanic circulation, El Niño events change global climate patterns.
- Some regions receive more than average rainfall, including the west coast of North and South America, the southern United States, and Western Europe.
- Drought occurs in other parts of South America, the western Pacific, southern and northern Africa, and southern Europe.
An El Niño cycle lasts one to two years. Often normal circulation patterns resume. Sometimes circulation patterns bounce back quickly and extremely, called La Niña.
In a La Niña year, as in a normal year, trade winds moves from east to west and warm water piles up in the western Pacific Ocean. Ocean temperatures along coastal South America are colder than normal (instead of warmer, as in El Niño). Cold water reaches farther into the western Pacific than normal.
Other important oscillations are smaller and have a local, rather than global, effect. The North Atlantic Oscillation mostly alters climate in Europe. The Mediterranean also goes through cycles, varying between being dry at some times, and warm and wet at others.
Long-term: 10,000s to millions of years
Many processes can cause climate to change. These include changes in the amount of energy the Sun produces over years; the positions of the continents over millions of years; in the tilt of Earth’s axis; orbit over thousands of years; that are sudden and dramatic because of random catastrophic events, such as a large asteroid impact; in greenhouse gases in the atmosphere, caused naturally or by human activities.
PLATE TECTONICS
Plate movement and location can alter climate. Over millions to tens of millions of years as seas open and close, ocean currents may distribute heat differently. For example, when all the continents are joined into one supercontinent (such as Pangaea), nearly all locations experience a continental climate except for a small area along the coast. When the continents separate, heat is more evenly distributed because there’s more coastal land and even interior land is, on average, closer to the ocean.
Plate tectonic movements may help start an ice age. When continents are located near the poles, ice can accumulate, which may increase albedo and lower global temperature. Low enough temperatures may start a global ice age.
Plate motions trigger volcanic eruptions, which release dust and CO2 into the atmosphere. Ordinary eruptions, even large ones, have only a short-term effect on weather. Massive eruptions of the fluid lavas that create lava plateaus release much more gas and dust, and can change climate for many years. This type of eruption is exceedingly rare; none has occurred since humans have lived on Earth.
MILANKOVITCH CYCLES
The most extreme climate of recent Earth history was the Pleistocene. This time period began 2 million years ago. Scientists attribute a series of ice ages of the Pleistocene to variation in the Earth’s position relative to the Sun, known as Milankovitch cycles. The Earth goes through regular variations in its position relative to the Sun. There appear to be three processes and each has a time period lasting tens of thousands of years. The shape of the Earth’s orbit changes slightly as it goes around the Sun. The orbit varies from more circular to more elliptical in a cycle lasting between 90,000 and 100,000 years. When the orbit is more elliptical, there is a greater difference in solar radiation between winter and summer.
The planet wobbles on its axis of rotation. At one extreme of this 27,000 year cycle, the Northern Hemisphere points toward the Sun when the Earth is closest to the Sun. Summers are much warmer and winters are much colder than now. At the opposite extreme, the Northern Hemisphere points toward the Sun when it is farthest from the Sun. This results in chilly summers and warmer winters.
The planet’s tilt on its axis varies between 22.1° and 24.5°. Seasons are caused by the tilt of Earth’s axis of rotation, which is at a 23.5° angle now. When the tilt angle is smaller, summers and winters differ less in temperature. This cycle lasts 41,000 years.
When these three variations are charted out, a climate pattern of about 100,000 years emerges. Ice ages correspond closely with Milankovitch cycles. Since glaciers can form only over land, ice ages only occur when landmasses cover the polar regions. Therefore, Milankovitch cycles are also connected to plate tectonics.
SUN VARIATION

Stars have life cycles. Some grow, some contract. The Sun is still growing and over the last 4.6 B years the size of the sun has increased and the energy it releases has increased by about 33%.
The amount of energy the Sun radiates is variable. Sunspots are magnetic storms on the Sun’s surface that increase and decrease over an 11-year cycle. When the number of sunspots is high, solar radiation is also relatively high. But the entire variation in solar radiation is tiny relative to the total amount of solar radiation that there is and there is no known 11-year cycle in climate variability. The Little Ice Age corresponded to a time when there were no sunspots on the Sun.
CHANGES IN ATMOSPHERIC GREENHOUSE GAS LEVELS

Since greenhouse gases trap the heat that radiates off the planet’s surfaces what would happen to global temperatures if atmospheric greenhouse gas levels decreased? What if greenhouse gases increased? A decrease in greenhouse gas levels decreases global temperature and an increase raises air temperature.
Greenhouse gas levels have varied throughout Earth history. For example, CO2 has been present at concentrations less than 200 parts per million (ppm) and more than 5,000 ppm. But for at least 650,000 years, CO2 has never risen above 300 ppm, during either glacial or interglacial periods. Natural processes add (volcanic eruptions and the decay or burning of organic matter) and remove absorption by plants, animal tissue, and the ocean) CO2 from the atmosphere. When plants are turned into fossil fuels the CO2 in their tissue is stored with them. So CO2 is removed from the atmosphere. What does this do to Earth’s average temperature? Fossil fuel use has skyrocketed in the past few decades more people want more cars and industrial products. This has released CO2 into the atmosphere. Burning tropical rainforests, to clear land for agriculture, a practice called slash-and-burn agriculture, also increases atmospheric CO 2. By cutting down trees, they can no longer remove CO2 from the atmosphere. Burning the trees releases all the CO2 stored in the trees into the atmosphere.
There is now nearly 40% more CO2 in the atmosphere than there was 200 years ago, before the Industrial Revolution. About 65% of that increase has occurred since the first CO2 measurements were made on Mauna Loa Volcano, Hawaii, in 1958. CO2 is the most important greenhouse gas that human activities affect because it is so abundant. But other greenhouse gases are increasing as well. A few are:
- Methane: released from raising livestock, rice production, and the incomplete burning of rainforest plants.
- Chlorofluorocarbons (CFCs): human-made chemicals that were invented and used widely in the 20th century.
- Tropospheric ozone: from vehicle exhaust, it has more than doubled since 1976.
Anthropogenic Climate Change
TEMPERATURES ARE RISING
With more greenhouse gases trapping heat, average annual global temperatures are rising. This is known as global warming. While temperatures have risen since the end of the Pleistocene, 10,000 years ago, this rate of increase has been more rapid in the past century, and has risen even faster since 1990. The nine warmest years on record have all occurred since 1998, and the 10 of the 11 warmest years have occurred since 2001 (through 2012). The 2000s were the warmest decade yet. Annual variations aside, the average global temperature increased about 0.8 °C (1.5 °F) between 1880 and 2010, according to the Goddard Institute for Space Studies, NOAA.
The United States has long been the largest emitter of greenhouse gases, with about 20% of total emissions in 2004. As a result of China’s rapid economic growth, its emissions surpassed those of the United States in 2008. However, it’s also important to keep in mind that the United States has only about one-fifth the population of China. What’s the significance of this? The average United States citizen produces far more greenhouse gases than the average Chinese person.
If nothing is done to decrease the rate of CO2 emissions, by 2030, CO2 emissions are projected to be 63% greater than they were in 2002.
FUTURE WARMING
The amount CO2 levels will rise in the next decades is unknown. What will this number depend on in the developed nations? What will it depend on in the developing nations? In the developed nations it will depend on technological advances or lifestyle changes that decrease emissions. In the developing nations, it will depend on how much their lifestyles improve and how these improvements are made. Computer models are used to predict the effects of greenhouse gas increases on climate for the planet as a whole and also for specific regions.
If nothing is done to control greenhouse gas emissions and they continue to increase at current rates, the surface temperature of the Earth can be expected to increase between 0.5 °C and 2.0 °C (0.9 °F and 3.6 °F) by 2050 and between 2° and 4.5 °C (3.5° and 8 °F) by 2100, with CO2 levels over 800 parts per million (ppm). On the other hand, if severe limits on CO2 emissions begin soon, temperatures could rise less than 1.1 °C (2 °F) by 2100.
Whatever the temperature increase, it will not be uniform around the globe. A rise of 2.8 °C (5 °F) would result in 0.6° to 1.2 °C (1° to 2 F) at the equator, but up to 6.7 °C (12 °F) at the poles. So far, global warming has affected the North Pole more than the South Pole, but temperatures are still increasing at Antarctica.
The timing of events for species is changing. Mating and migrations take place earlier in the spring months. Species that can are moving their ranges uphill. Some regions that were already marginal for agriculture are no longer farmable because they have become too warm or dry.
Glaciers are melting and vegetation zones are moving uphill. If fossil fuel use exploded in the 1950s, why do these changes begin early in the animation? Does this mean that the climate change we are seeing is caused by natural processes and not by fossil fuel use?
As greenhouse gases increase, changes will be more extreme. Oceans will become slightly more acidic, making it more difficult for creatures with carbonate shells to grow, and that includes coral reefs. A study monitoring ocean acidity in the Pacific Northwest found ocean acidity increasing ten times faster than expected and 10% to 20% of shellfish (mussels) being replaced by acid tolerant algae.
Plant and animal species seeking cooler temperatures will need to move poleward 100 to 150 km (60 to 90 miles) or upward 150 m (500 feet) for each 1.0 °C (8 °F) rise in global temperature. There will be a tremendous loss of biodiversity because forest species can’t migrate that rapidly. Biologists have already documented the extinction of high-altitude species that have nowhere higher to go.
Decreased snow packs, shrinking glaciers, and the earlier arrival of spring will all lessen the amount of water available in some regions of the world, including the western United States and much of Asia. Ice will continue to melt and sea level is predicted to rise 18 to 97 cm (7 to 38 inches) by 2100. An increase this large will gradually flood coastal regions where about one-third of the world’s population lives, forcing billions of people to move inland.
Summary
Weather will become more extreme with heat waves and droughts. Some modelers predict that the Midwestern United States will become too dry to support agriculture and that Canada will become the new breadbasket. In all, about 10% to 50% of current cropland worldwide may become unusable if CO2 doubles. There are global monitoring systems to help monitor potential droughts that could turn into famines if they occur in politically and socially unstable regions of the world and if appropriate action isn’t taken in time. One example is FEWS NET, which is a network of social and environmental scientists using geospatial technology to monitor these situations. But even with proper monitoring, if nations don’t act, catastrophes can occur like in Somalia from 2010-2012.
Although scientists do not all agree, hurricanes are likely to become more severe and possibly more frequent. Tropical and subtropical insects will expand their ranges, resulting in the spread of tropical diseases such as malaria, encephalitis, yellow fever, and dengue fever.
You may notice that the numerical predictions above contain wide ranges. Sea level, for example, is expected to rise somewhere between 18 and 97 cm — quite a wide range. What is the reason for this uncertainty? It is partly because scientists cannot predict exactly how the Earth will respond to increased levels of greenhouses gases. How quickly greenhouse gases continue to build up in the atmosphere depends in part on the choices we make.
An important question people ask is this: Are the increases in global temperature natural? In other words, can natural variations in temperature account for the increase in temperature that we see? The scientific data shows no, natural variations can not explain the dramatic increase in global temperatures. Changes in the Sun’s irradiance, El Niño and La Niña cycles, natural changes in greenhouse gas, plate tectonics, and the Milankovitch Cycles cannot account for the increase in temperature that has already happened in the past decades.
In December 2013 and April 2014, the Intergovernmental Panel on Climate Change (IPCC) released a series of damaging reports on not only the current scientific knowledge of climate change, but also on the vulnerability and impacts to humans and ecosystems. Below are two videos detailing the physical science of climate change (Working Group I), and the risks and impacts to the planet (Working Group II). But it is important to get a strong, data driven understanding of climate change. Along with the IPCC, other organizations like the United Nations Environmental Programme (UNEP), World Health Organizations, World Meteorological Organization (WMO), NASA, the National Oceanic and Atmospheric Administration (NOAA), and the U.S. Environmental Protection Agency (EPA).
