Note: use a mouse instead of a trackpad or touchscreen to limit frustration while using Afterglow.
Click “Next” above to see the step-by-step instructions.
Alternate Format: Video Instructions
- Follow along with part of this tutorial video
Alternate Format: Written Instructions
- Open the graphing website: https://skynet.unc.edu/ASTR101L/graph/
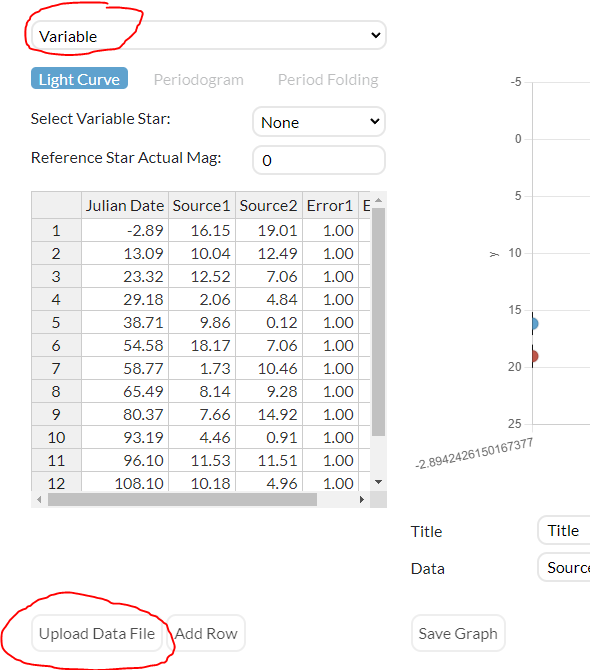
- Select “Variable.”
- Click “Upload Data File” and choose the .csv file you downloaded during part B.
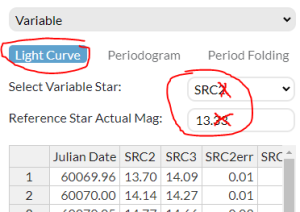
- Select Variable Star: This is the number assigned by Afterglow to the RRL star. You wrote this down as the answer to B1 on the observation report. (For me it was “2” and so in this location I select “SRC2”. Yours will probably be different.)
- Reference Star Actual Mag: This number depends on which cluster was observed:
- If we observed NGC 1261: enter 13.87
- If we observed NGC 3201: enter 13.6
- If we observed M28: enter 12.98
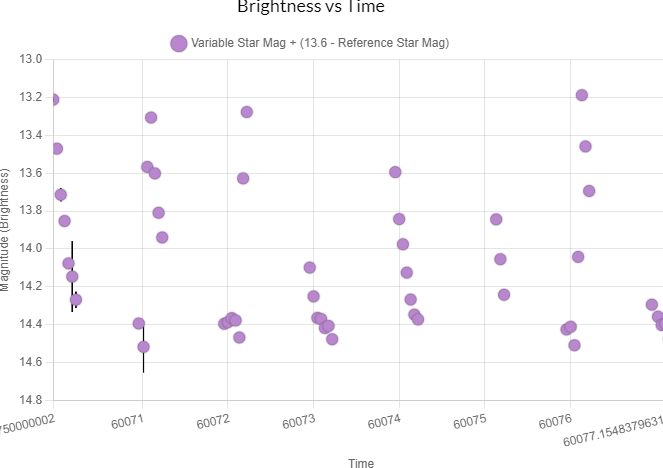
- Your graph should have several sorta-columns of data points. If it doesn’t, you may have selected the incorrect source as the variable star, or measured the wrong star.
-
- Give your graph a title and label the axes.
- We’re plotting magnitude (vertical axis) versus time (horizontal axis).
- Save and insert this graph into your assignment.
Alternate Format: New Tool
Media Attributions
- Upload data file
- Light Curve Settings
- Magnitude vs Time