Plotting Moon Orbits
Instructions for the old tool
Click “Next” above to see the step-by-step instructions.
Alternate Format: Video Instructions
- Follow along with this tutorial video
Alternate Format: Written Instructions
- Set the graphing page to “Moon” with the dropdown menu.
- Copy and paste your data from part A into the table for the graph
- If it shows an error:
- Check that you have only numbers and no units in the data.
- Overwrite all existing data on the graphing page
- Check that your decimal places look correct (just one numeral after the decimal point)
- If it shows an error:
- Label your graph
- Label your X axis, by typing in the box labeled “X Axis”. The X axis is showing the date.
- Label your Y axis, by typing in the box labeled “Y Axis”. The Y axis is showing angular separation
- Title your graph, typing in the box labeled “Title”.
- Hint: what is your graph comparing?
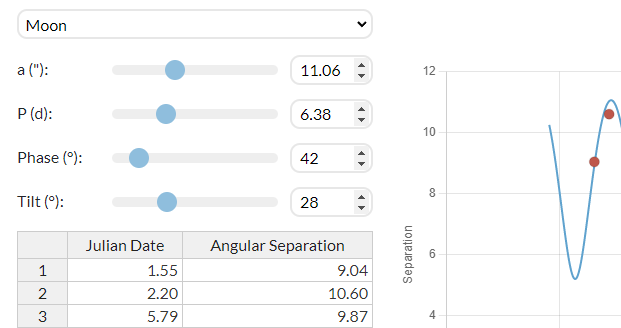
- Adjust the fit of the model on your graph
- Move the slider bars in the upper left: a (” – arcseconds), P (d – days), Phase (° – degrees), and Tilt (° – degrees).
- Adjust until the blue model line goes through, or almost goes through, every red data dot.
- The model line shows where we should see a moon that is orbiting with the characteristics you have set on the sliders.
- Sliders:
- Look up the true orbital period (P) of your moon around its planet.
- Google or use a search engine to find the number of days it takes your moon to orbit its planet once.
- Record this value at the end of the Skynet 3-1 Observation Report
- If this is quite different than your “P(d)” slider, enter this number as P(d) on that slider and adjust the rest of the values until the blue line matches your data again.
- Save your graph and insert it into your assignment.
- On the bottom middle there is a button “Save Graph”
- Embed the image.
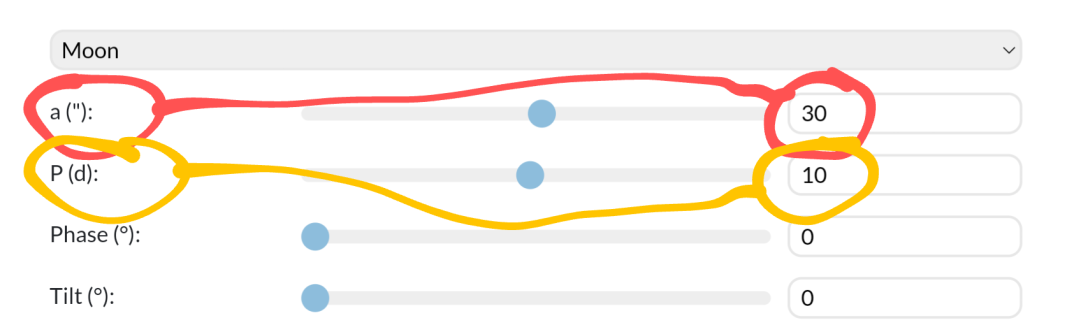
- Record a(“) and P(days) from the graphing page on your assignment
Instructions for the new tool
Media Attributions
- Moon orbit sliders
- Read a and P off the sliders