2.2 Crime Statistic Data Sources
Crime statistics are vital for understanding and addressing criminal behavior and trends. One of the largest and most reliable sources of U.S. crime data is the Uniform Crime Report (UCR). The UCR, a compilation of official data on crime reported to law enforcement agencies across the United States, provides insights into reported crimes and arrests. Complementing the UCR is the National Incident-Based Reporting System (NIBRS). By providing detailed information on each crime incident, the NIBRS offers a more comprehensive view of crime patterns. The National Crime Victimization Survey (NCVS) offers a broader perspective; it gathers data on personal and household victimization through surveys and interviews, including individual experiences with criminal activities as well as crimes that may not be reported to police officials. Additionally, self-report crime surveys collect data by directly questioning individuals about their involvement in illicit activities. Use of this method often uncovers unreported crimes and sheds light on underrepresented demographics. Together, these sources provide multifaceted insights into the complex landscape of crime, crucial for researchers, policymakers, and law enforcement agencies, thus enabling informed decision-making and targeted interventions aimed at fostering safer communities.
Crime research methods encompass a diverse range of approaches employed to comprehend and deal with specific aspects of criminal behavior and its impact. General methods pertaining to social research include quantitative research, which involves collecting and analyzing numerical data to identify patterns and correlations; qualitative research, which focuses on examining the underlying meanings and motivations behind criminal behavior through in-depth interviews, observations; and case studies. Additionally, experimental research techniques involve manipulating certain variables to assess their impact on criminal behavior, while observational research involves observing and recording criminal activities in natural settings. These varied research approaches contribute to a comprehensive understanding of crime and inform evidence-based policies and interventions designed to mitigate criminal behavior and bolster public safety.
| Date | Milestones |
|---|---|
| 1930 | First publication of the Uniform Crime Report (UCR). |
| 1937 | Law Enforcement Officers Killed and Assaulted (LEOKA) data collection begins. |
| 1972 | The Federal Bureau of Investigation (FBI) publishes Hate Crime Statistics. |
| 1973 | First publication of the National Crime Victimization Survey (NCVS). |
| 1973 | The Sourcebook of Criminal Justice Statistics (SCJS) begins publishing criminal justice data. |
| 1975 | The University of Michigan administers the Monitoring the Future (MTF) survey. |
| 1979 | The Bureau of Justice Statistics (BJS) is established. |
| 1989 | The National Incident-Based Reporting System (NIBRS) begins publishing comprehensive data on crime incidents. |
| 1991 | The MTF includes eighth- and tenth-grade students in its survey. |
| 2004 | The NCVS implements a Spanish version of the survey. |
| 2013 | The UCR revises its definition of rape. |
| 2019 | The FBI begins gathering national data on police use-of-force incidents. |
| 2021 | NIBRS replaces UCR. |
Note. Chart demonstrating key advancements in U.S. criminal justice data. Compiled by Wesley B. Maier, Ph.D., & Kadence C. Maier.
Uniform Crime Report (UCR)
In 1930, with the assistance of the International Association of Chiefs of Police, Congress passed legislation authorizing the U.S. Attorney General and the Federal Bureau of Investigation (FBI) to develop a program to monitor and quantify crime rates across the US (An Act Establishing Division of Identification and Information). This program, known as the Uniform Crime Report (UCR) (Stogner, 2015), collected data from local and state police departments that voluntarily provided information on reported crimes and arrests for specific offenses to the FBI. For the next 90 years, the UCR became the most readily available source of national crime data.
By the 21st century, the majority of police agencies covering 98% of the U.S. population shared their data with the FBI (FBI, 2014). To organize this massive amount of data, the UCR separated crime data into two primary groups: Part I offenses and Part II offenses. The UCR collected reported crime data on 10 Part I offenses, which are seen as more serious criminal offenses and include criminal homicide, rape, robbery, aggravated assault, burglary, larceny-theft, motor vehicle theft, arson, human trafficking for commercial sex acts, and human trafficking for involuntary servitude. Part II offenses are considered less serious and include only arrest data rather than reported data. Part II offenses consist of 20 less serious crimes, such as vandalism, gambling, simple assault, and vagrancy.
The UCR presented data in three primary ways. First, it provided raw numbers of arrests or reported crimes. For example, in 2019, there were approximately 16,425 murders reported nationwide (FBI, 2020a). Second, the UCR presented crime rates using per capita of a rate per 100,000 people. Simply stated, this is achieved by dividing the numerical value by the total population and subsequently multiplying the result by 100,000. To illustrate, consider the previous example of 16,425 estimated murders in the US in 2019. By dividing this figure by the estimated total U.S. population of 328 million, then multiplying it by 100,000 (16,425 / 328,000,000 X 100,000), we ascertain that the 2019 per capita murder rate in the US was approximately 5.0 murders per 100,000 people. Third, the UCR supplied a year-to-year comparison with information regarding changes in crime rates from previous years. For example, there was a 0.2% decrease in the U.S. murder rate from 2018 to 2019 (FBI, 2020a).
Drawbacks of the Uniform Crime Report
One drawback of the UCR data was its reliance on reported crimes, which means that only incidents reported to the police were included. As discussed in the previous chapter, not all criminal activities are brought to the attention of law enforcement, resulting in underrepresentation of the total number of criminal acts (Levitt, 1998). The voluntary nature of police department participation in the UCR program posed another challenge. When a department chose to not share crime data with the FBI, crime rates for that jurisdiction were estimated by comparing them with those in nearby jurisdictions of similar size. Furthermore, even when departments do participate and share data voluntarily, variations in laws, policies, and procedures regarding the collection and recording of crime can lead to discrepancies. The fact that some departments might report certain criminal behaviors that others did not further complicated the accuracy and reliability of the collected UCR data.
One significant challenge with UCR data was the hierarchy rule, which establishes a ranking of offenses based on their severity. Under this rule, murder ranks higher than aggravated assault, which in turn ranks higher than larceny (FBI, 2015). According to this rule, if multiple offenses occur in a single criminal incident, only the most serious offense is counted. For instance, if a murder took place during a burglary, only the murder would be recorded in the UCR data because it ranks higher in the hierarchy. This presents a notable issue as it results in fewer crimes being recorded than actually occur, thus creating an inaccurate picture of the full scope of criminal activity. Additionally, it can create the impression that more serious crimes constitute a larger proportion of criminal activity than they do in reality.
Another drawback of the UCR was that it did not distinguish between attempted and completed Part I offenses. This means that if an individual was stopped before completing a Part I offense and the action was reported, it was recorded as a completed crime in the UCR database. This could lead to an overestimation of the actual number of Part I offenses occurring.
Over the years, numerous modifications were made to the UCR, including the addition of information concerning incidents involving police officers being killed or assaulted and data on hate crimes. While these changes were generally beneficial, changes in definitions were sometimes problematic as they could cause shifts in recorded statistics and lead to misconceptions when comparing statistics from before and after the definition change.
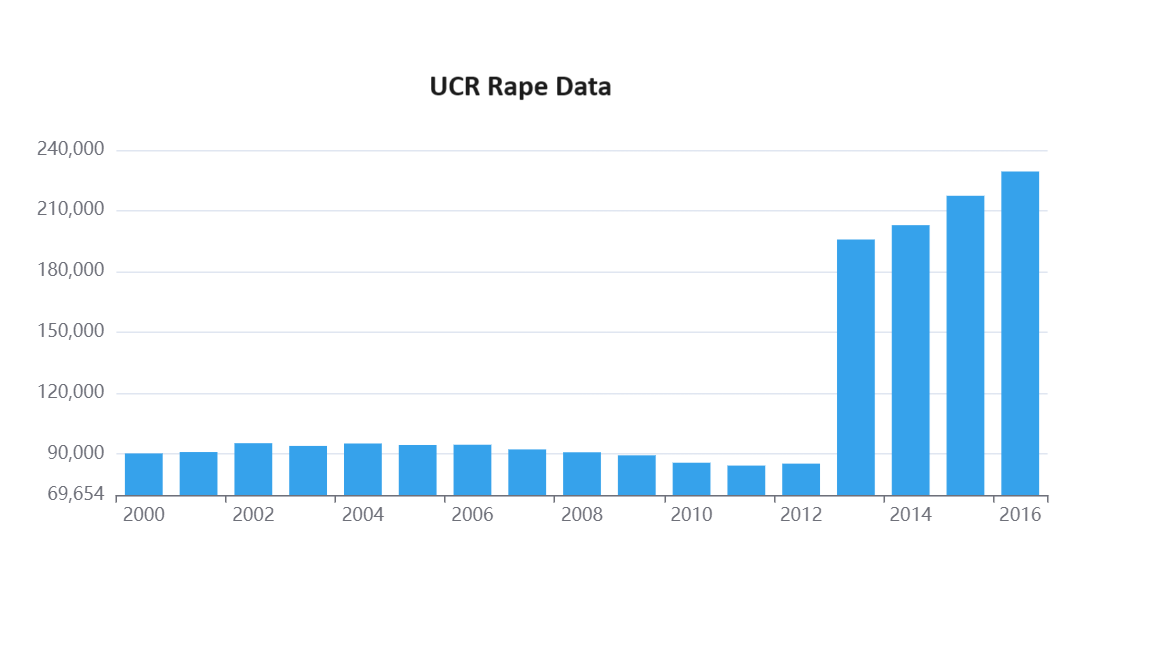
For instance, one of the more controversial issues with the UCR was the definition used for rape between 1929 and 2012. Prior to 2013, the definition of forcible rape used in UCR data was “the carnal knowledge of a female forcibly and against her will” (FBI, 2017, p. 3). This definition meant that only females were included in rape statistics, and only rapes involving force or the threat of force were recorded. As shown in Figure 2.7 below, changing the definition of rape in 2013 to include men and omitting the use-of-force standard significantly altered the number of rapes recorded in the UCR.
National Incident-Based Reporting System (NIBRS)
In 1982, the Bureau of Justice Statistics (BJS) and the FBI conducted a study to determine the feasibility and benefits of adapting a more comprehensive national crime data collection system (Poggio et al., 1985). The results of the study indicated a significant need to improve the data-gathering process to include more detailed information in several areas, including weapon use, gang violence, and crimes against children (Strom & Smith, 2017). In 1989, the National Incident-Based Reporting System (NIBRS) was introduced (FBI, 2018). However, it was not until 2021 that the NIBRS became the mandated national standard for law enforcement agencies reporting crime data to the FBI (BJS, 2022a).
The NIBRS differs from the original UCR data collection practices in several key ways. First, UCR only used aggregate data, which does not include specifics of each crime. In contrast, the NIBRS incorporates disaggregated data, providing demographic information about the offender and victim, the relationship between the victim and offender, details on the context of offense characteristics, and incident-level data (Loftin & McDowall, 2010). Secondly, the NIBRS does not adhere to the hierarchy rule and can include up to 10 offenses per incident. Additionally, the NIBRS covers a broader range of crime offenses. For example, while the UCR included only 10 Part I offenses, the NIBRS includes 49 Group A offenses encompassing high-level crimes, such as murder, assault, and arson, as well as 10 Group B offenses, which cover low-level crimes, such as public drunkenness, curfew violations, and writing faulty checks.
Weaknesses of the National Incident-Based Reporting System
While the data the NIBRS gathers is superior to the traditional UCR data, it has a number of weaknesses. One prevailing issue is the failure of police departments to report their data to the NIBRS. For instance, in 2022, only 77% of U.S. police agencies submitted data to the NIBRS (FBI National Press Office, 2023). Although an additional 16.6% of departments reported UCR data during that same year, the Department of Justice (DOJ) and FBI have to devise crime estimates for all jurisdictions that fail to submit their data to the NIBRS. These approximations hinder the overall strength and accuracy of the statistics the NIBRS produces, which could be improved if more police agencies reported their crime data to the NIBRS. Lastly, while the NIBRS data is much more robust than the original UCR data, it still fails to capture unreported crimes. This limitation makes it difficult to accurately compare crime rates across cities, counties, and states. For example, if citizens lack trust in the police or believe the police will be unable to solve the crime, they might be less inclined to report crimes. Similarly, if a police department is understaffed or focused only on serious crimes, it might fail to report all crimes it deems unsolvable or insignificant.
National Crime Victimization Survey (NCVS)
Crime victimization surveys are a valuable tool for capturing some unreported crimes or Dark Figures. Presently, the nation’s primary victimization survey is the National Crime Victimization Survey (NCVS). The NCVS has been conducted annually since its commencement in 1973 through a joint effort of the Law Enforcement Assistance Administration (LEAA) and the U.S. Census Bureau (Eckroth, 2023). Despite the disbandment of the LEAA in 1979, the Bureau of Justice Statistics (BJS) has continued the yearly administration of the survey.
The NCVS collects a plethora of victimization data through interviews and surveys of individuals aged 12 years and older (Morgan & Smith, 2023). One of the most beneficial aspects of the NCVS is its ability to capture dark figures by measuring unreported crimes. This is invaluable for determining the extent of underreported crimes and discerning the reasons why victims may choose not to report crimes to the police. Additionally, the data the NCVS collects provides crucial information about the nature of the crime, the victim, the relationship between the victim and offender, and the consequences of victimization.
More specifically, the NCVS collects highly detailed demographic information from victims, including age, income, race, ethnicity, gender, and geographical location. This information plays a pivotal role in identifying patterns and disparities in victimization rates, thereby enabling tailored prevention and intervention efforts for underrepresented populations. Moreover, due to its annual administration, the NCVS facilitates longitudinal analysis. These analyses help researchers, law enforcement agencies, and policymakers identify changes in crime patterns over time and devise potentially more effectively adjusted crime prevention strategies.
Shortcomings of the National Crime Victimization Survey
Like any research and data collection method, the NCVS has its limitations. One such shortcoming is its exclusion of certain populations, including children younger than 12, homeless individuals, and those living in institutional settings, such as nursing homes and correctional facilities. As a result, the NCVS data underrepresents these groups and fails to provide a comprehensive understanding of all cross sections of society. Another limitation is its predominant focus on personal and property crimes, which often neglects other types of crime, such as white-collar crime, organized crime, and cybercrimes.
Another challenge with the NCVS, akin to all interview and survey data collection methods, is the potential variation in the interpretation of victimization definitions among respondents and interviewers. This variability can result in inconsistencies in both reporting and classification of victimization incidents. Furthermore, some respondents may encounter difficulties accurately recalling details about their victimization experiences, including the timing, nature, and circumstances of the crime.
Self-Report Surveys
Another method of monitoring crime is through the use of self-report surveys. Unlike crime data collected through police reports or victimization surveys, self-report crime surveys directly inquire about individuals’ participation in illegal activities irrespective of whether the activity was reported to the police. These surveys are particularly effective in uncovering data on victimless crimes where there may not be a direct victim, as in illicit drug use. Typically, these surveys are administered anonymously to large groups of individuals, often in school, community, or household settings.
One of the largest self-report crime surveys is the Monitoring the Future (MTF) national survey. Administered annually by the University of Michigan Survey Research Center since 1975 (Monitoring the Future, n.d.), the original MTF survey was distributed to approximately 16,000 senior high school students in 133 public and private high schools. Since 1991, the MTF survey has expanded to include eighth, 10th, and 12th graders, totaling around 50,000 students and 420 public and private schools yearly. Additionally, a subset of participants receives yearly follow-up surveys throughout secondary school, college, and adulthood. This longitudinal approach allows researchers to gain insight into how perceptions of crime and drug use evolve over the individual’s life span.
Limitations of Self-Report Crime Surveys
Self-report crime surveys, such as the MTF, offer valuable insights into “dark figures” and juvenile perspectives on crime and drug use. However, these surveys also have limitations. First, despite being anonymous, participants may still feel ashamed or fearful of providing truthful information. Additionally, individuals may exaggerate their criminal behavior or forget important details of these acts. Furthermore, like any survey, misinterpretation of the questions may lead participants to provide inaccurate information.
Attributions
- Figure 2.7: Alterations to Rape Definitions and Their Impact on Statistics: 2000-2016 by Federal Bureau of Investigation in the Public Domain; U.S. government works created by a federal government employee as part of their official duties are in the public domain.
- Figure 2.8: data-analysis-icon by Oscar de Lama is released under CC BY NC 2.0
A program administered by the Federal Bureau of Investigation (FBI) since the 1930s, designed to collect and analyze data on crimes reported to law enforcement agencies across the United States. These statistics are divided into two main categories: Part I offenses (such as murder, rape, robbery, aggravated assault, burglary, larceny-theft, motor vehicle theft) and Part II offenses (such as simple assault, fraud, embezzlement, vandalism). This data is used by policymakers, researchers, and law enforcement agencies to assess crime trends, allocate resources, and develop strategies for crime prevention and reduction.
A method of inquiry used in various academic disciplines, including sciences, social sciences, and economics, that relies on the collection and analysis of numerical data to draw conclusions and make predictions about phenomena. This approach typically involves structured data collection methods, such as surveys, experiments, or observations, and employs statistical techniques for data analysis to identify patterns, relationships, and trends.
A methodological approach used in social sciences and other fields to understand human behavior, experiences, and perceptions. It focuses on gathering nonnumerical data through techniques such as interviews, observations, and analysis of texts or images. Qualitative research aims to uncover rich insights into the complexities of human phenomena, often exploring nuances and context rather than generalizable conclusions.
In research and academic contexts, case studies are in-depth examinations of a single person, group, event, or situation over a period of time. They are used to explore and analyze complex issues in real-world settings, providing detailed insights that can help illustrate broader principles and concepts. Case studies are commonly employed in various fields such as psychology, medicine, education, business, and social sciences to understand the underlying mechanisms, generate hypotheses, and apply theoretical knowledge to practical situations.
A scientific method used to investigate cause-and-effect relationships between variables. In this type of research, researchers manipulate one or more independent variables to observe their effects on dependent variables, while controlling for extraneous variables. The goal is to establish a causal relationship between the variables under study.
A U.S. government agency under the Department of Justice that collects, analyzes, and publishes data on crime, criminal offenders, victims of crime, and the operation of justice systems at all levels of government. The BJS provides reliable statistics to inform policymakers, researchers, and the public about crime trends, the functioning of the justice system, and issues related to law enforcement, courts, and corrections.
A federal law enforcement agency of the U.S. Department of Justice responsible for investigating and enforcing federal laws, conducting intelligence operations, and protecting the country from domestic and international threats.
A principle used in the Uniform Crime Reports (UCR) system to ensure that only the most serious offense is counted when multiple offenses occur in a single criminal incident. According to this rule, when more than one crime is committed during a single event, only the most serious offense is reported to avoid double counting and to maintain consistency in crime statistics. This rule was enacted to help standardize crime data collection and reporting across different law enforcement agencies and jurisdictions. However, there exists disagreement regarding the rule's determination and rankings of crimes by their severity. Furthermore, it fails to provide comprehensive accounts of criminal activity where more than one crime transpires during a singular event, which is problematic for acquiring complete understandings of criminal activity.
A comprehensive and standardized crime reporting system used by U.S. law enforcement agencies that collects and reports detailed data on criminal incidents, including information about victims, offenders, and circumstances surrounding the crime, providing detailed and accurate crime statistics to law enforcement agencies and policymakers and allowing for a more comprehensive understanding of criminal activity compared to traditional Uniform Crime Reporting (UCR) systems.
Data that is collected and presented in a summarized format, combining information from multiple sources or observations to provide a comprehensive overview. This type of data is often used to identify trends, patterns, and insights on a larger scale, rather than focusing on individual data points. For example, aggregate data can show the average income of a population, total sales in a region, or the overall performance of a group of students.
Information that has been broken down into smaller, more specific parts or categories. This breakdown allows for a more detailed analysis of the data, often revealing trends or patterns that may not be apparent when looking at the data in its aggregate form. Disaggregated data is useful for gaining insights into specific demographics, regions, or variables within a larger dataset.
A federal executive department in the US responsible for ensuring justice and enforcing federal laws. It oversees various law enforcement agencies, including the Federal Bureau of Investigation (FBI) and the Drug Enforcement Administration (DEA), and provides legal advice and representation to the government. The DOJ is headed by the Attorney General, who is the chief law enforcement officer of the federal government.
Unreported or undetected criminal incidents that do not appear in official crime statistics. These incidents may include crimes that victims choose not to report to law enforcement agencies, as well as crimes that go unnoticed or unrecorded by authorities.
A recurring survey conducted by the Bureau of Justice Statistics in the US aiming to measure the frequency and nature of criminal victimization experienced by individuals and households across the nation. The survey collects data on various types of crime, including, but not limited to, violent crimes (such as assault and robbery) and property crimes (such as burglary and theft), providing valuable insights into crime trends and victim demographics.
A federal U.S. agency established in 1968 to provide financial and technical assistance to state and local law enforcement agencies, aiming to enhance their capabilities, training, infrastructure, and criminal justice initiatives.
A research method used to study changes in variables over time within the same individuals or groups. It involves collecting data at multiple points in time to track patterns, trends, and relationships. This approach allows researchers to observe how variables evolve, providing insights into developmental processes, trends, and causal relationships.
Certain activities which, under the law, are prohibited, or that are held in scorn by society. Examples are gambling, prostitution, and viewing pornography. Engagement in these crimes may impact others in society.
A long-term research project conducted by the University of Michigan aiming to track trends and behaviors among American youth. It examines attitudes, beliefs, and behaviors related to drug use, alcohol consumption, and other social issues through surveys conducted regularly among high school students and young adults.
