19.2 Nondestructive Examination
David Colameco, M.Ed.
Basics of Nondestructive Examination
Nondestructive examination (NDE) describes a set of examination techniques that do not destroy the fabrication being inspected. In contrast, destructive tests provide information that cannot be determined by nondestructive tests, such as the tensile and yield strength of a weld. However, if we only performed destructive tests on our weldment, we wouldn’t have any fabrications to place in-service because they would all be destroyed. The basic premise of a nondestructive test is to provide the inspector with information about the quality of the weldment without damaging or altering it.
Uses of Nondestructive Examination in Industry Today
As a welder in school learning to weld, you should visually inspect your welds and your classmates’ welds whenever you get a chance. It is highly recommended that you take pictures of your welds each week so you can see the progress you have made with time.
In industry, especially at fabrication shops with quality assurance programs, there will be a weld sample board with examples for welders to see what acceptable and unacceptable welds look like. The purpose of these examples is to not only provide you with a comparison to determine if you are doing a good job welding, but to also provide an example weld to strive for so your welds meet a minimum quality standard that will more likely pass the official quality inspection.
Inspectors, such as an American Welding Society (AWS) Certified Welding Inspector (CWI) will examine your welds using the NDE techniques described in this chapter. Recall that testing and examination have different meanings: nondestructive testing refers to the testing itself, while NDE refers to the testing and the interpretation of the results.
Depending on the code used, in general the more critical the application of your weldment, the more stringent the inspection requirements will be. NDE is used by industry to ensure that quality weldments are being made to meet both safety and quality requirements and expectations that customers have. Let’s discuss some of the more common NDE methods used by industry today.
Visual Inspection
Visual inspection (VT) is the most common inspection method used today because it is relatively easy to do and welders and inspectors are expected to have a minimum level of visual acuity—meaning the ability to see minor details—to inspect welds. Common visual discontinuities that VT is intended to find are:
- overlap,
- porosity,
- slag inclusions,
- cracks such as crater cracks,
- spatter, and
- arc strikes.
A discontinuity becomes a defect if its size or number of occurrences exceeds the criteria in a welding code or standard being used for inspection. Let’s review them in detail.
Overlap
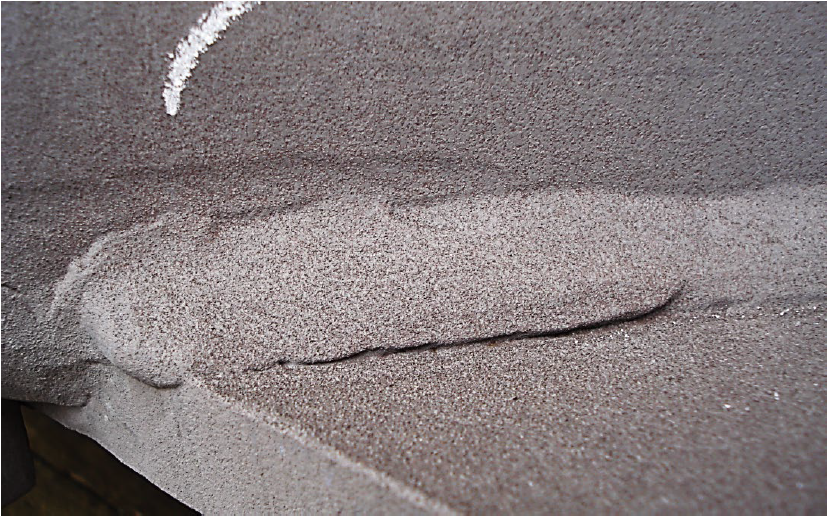
Overlap occurs when the molten weld pool does not fuse into the base material. Instead, the weld pool is on top of the base material and is not solidly connected to it. Other terms used for overlap are cold roll and cold lap. Figure 19.1 shows an example of overlap.
Porosity
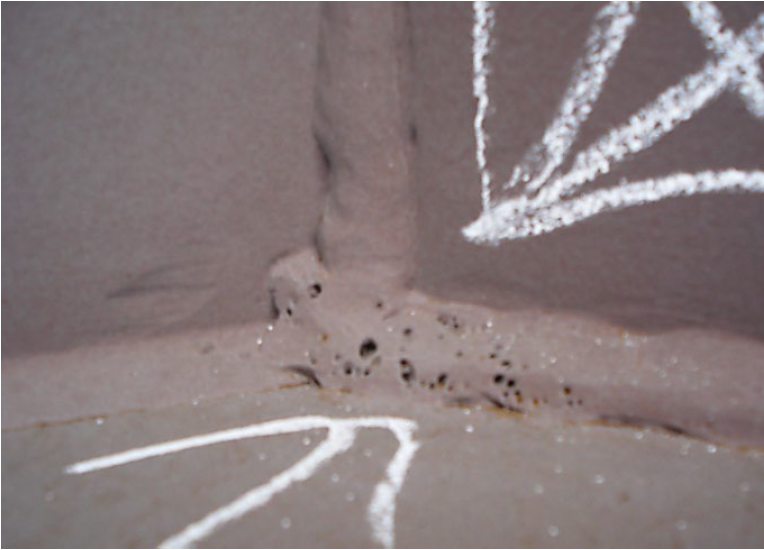
Porosity occurs when gasses produced during welding can not escape the molten weld pool before it solidifies. The gas occupies volume that the solidifying weld pool cannot occupy. If the welding process involves slag, the slag could be what blocked the gas from escaping. Figure 19.2 shows an example of porosity in a solidified weld bead.
Porosity weakens the weld because there isn’t solid material to take up the load applied to the weldment. Fortunately, porosity is circular or rounded, which means that each pore will not create a devastating stress riser by itself. Stress risers are areas where lines of stress concentrate. If too much stress exists in one area, the yield strength of the material may be exceeded, which would cause plastic deformation of the material and possible failure of the weldment.
Welding codes for steel will typically not allow porosity or limit it to a low number of pores for welder qualification tests. Aluminum, by nature of the welding process, has more porosity than steel.
Slag Inclusions
Slag inclusions are a very important piece of the welding processes that form slag. Slag forms when certain elements in the fluxes of the consumables react with elements in the weld that are impurities; therefore, they must be removed to ensure a quality weld. The impurities that must be removed bond with the elements in the flux that were added to bond to the impurities, and they float to the surface of the weld pool to form slag.
The designers of the consumables—whether that be the flux coatings on shielded metal arc welding (SMAW) electrodes, the flux within flux-cored arc welding (FCAW) wires, or even the granular flux used in submerged arc welding—develop them to remove impurities. Gas metal arc welding (GMAW) and gas tungsten arc welding (GTAW) are processes that do not produce a slag. If the welds suffered defects during the testing phase of the consumables’ development, the chemistry of the flux would be changed. This change is done much like a baker or chef changes a recipe if the tested end product doesn’t have the taste, texture, or color desired.
Slag not only removes impurities from the weld pool, it also helps control the cooling rate of the weld pool by slowing down how fast the weld pool solidifies. Once a weld bead has been put in place, the slag must be removed by mechanical means before the next weld bead is put in place. This can be done using a chipping hammer, wire brush, or a wire wheel.
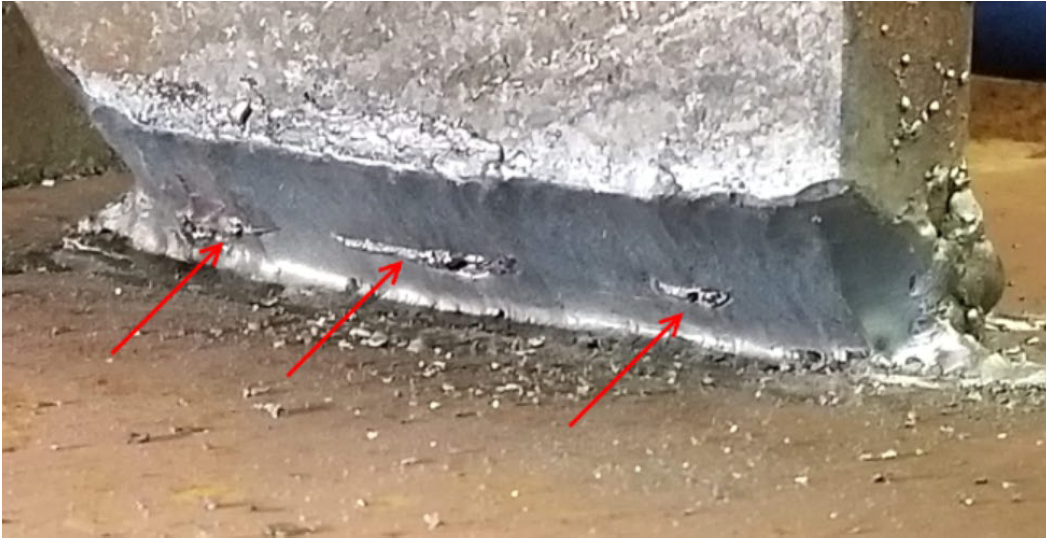
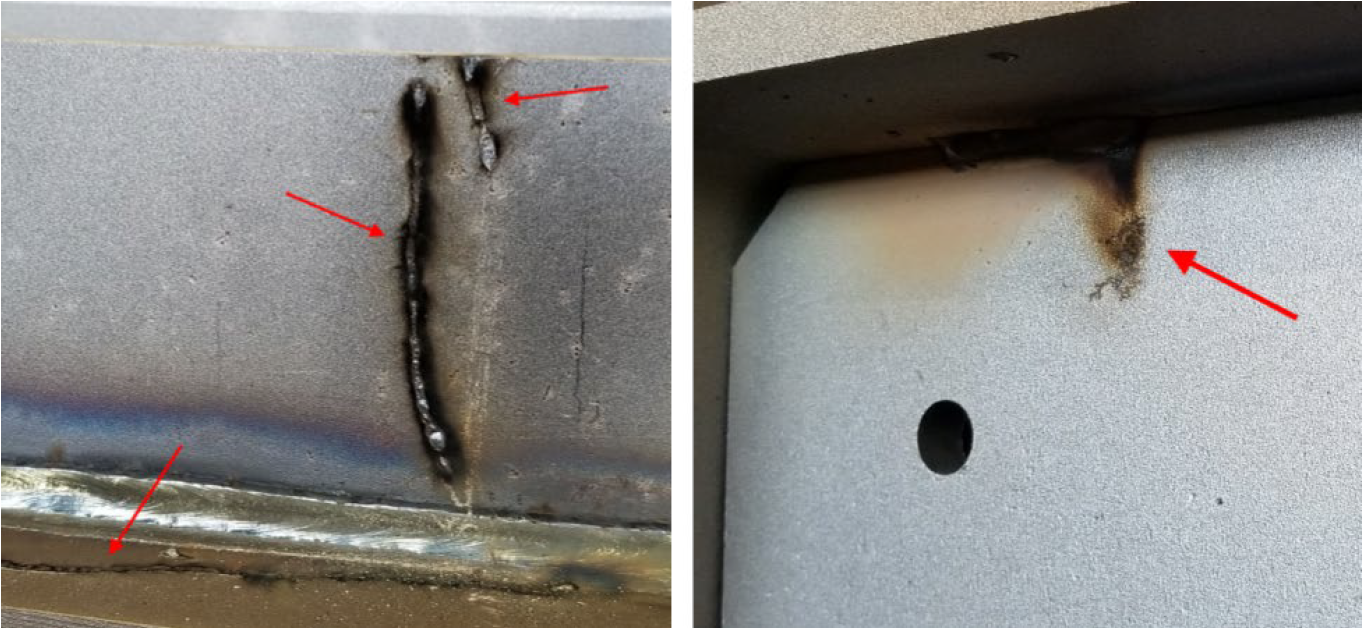
Figure 19.3 shows slag inclusions, with red arrows pointing them out.
Cracks
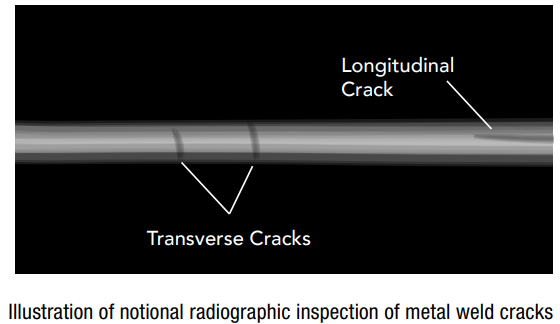
Cracks in welding are never acceptable because they will spread overtime, especially when they are exposed to a cyclical load. When describing cracks in welds, there are generally three types: a transverse crack, which occurs perpendicular to the direction of travel of the weld bead; a longitudinal crack, which occurs parallel to the direction of travel of the weld bead; and a crater crack, which usually occurs in a depression or crater at the end of a weld bead and radiates out from the center of the crater.
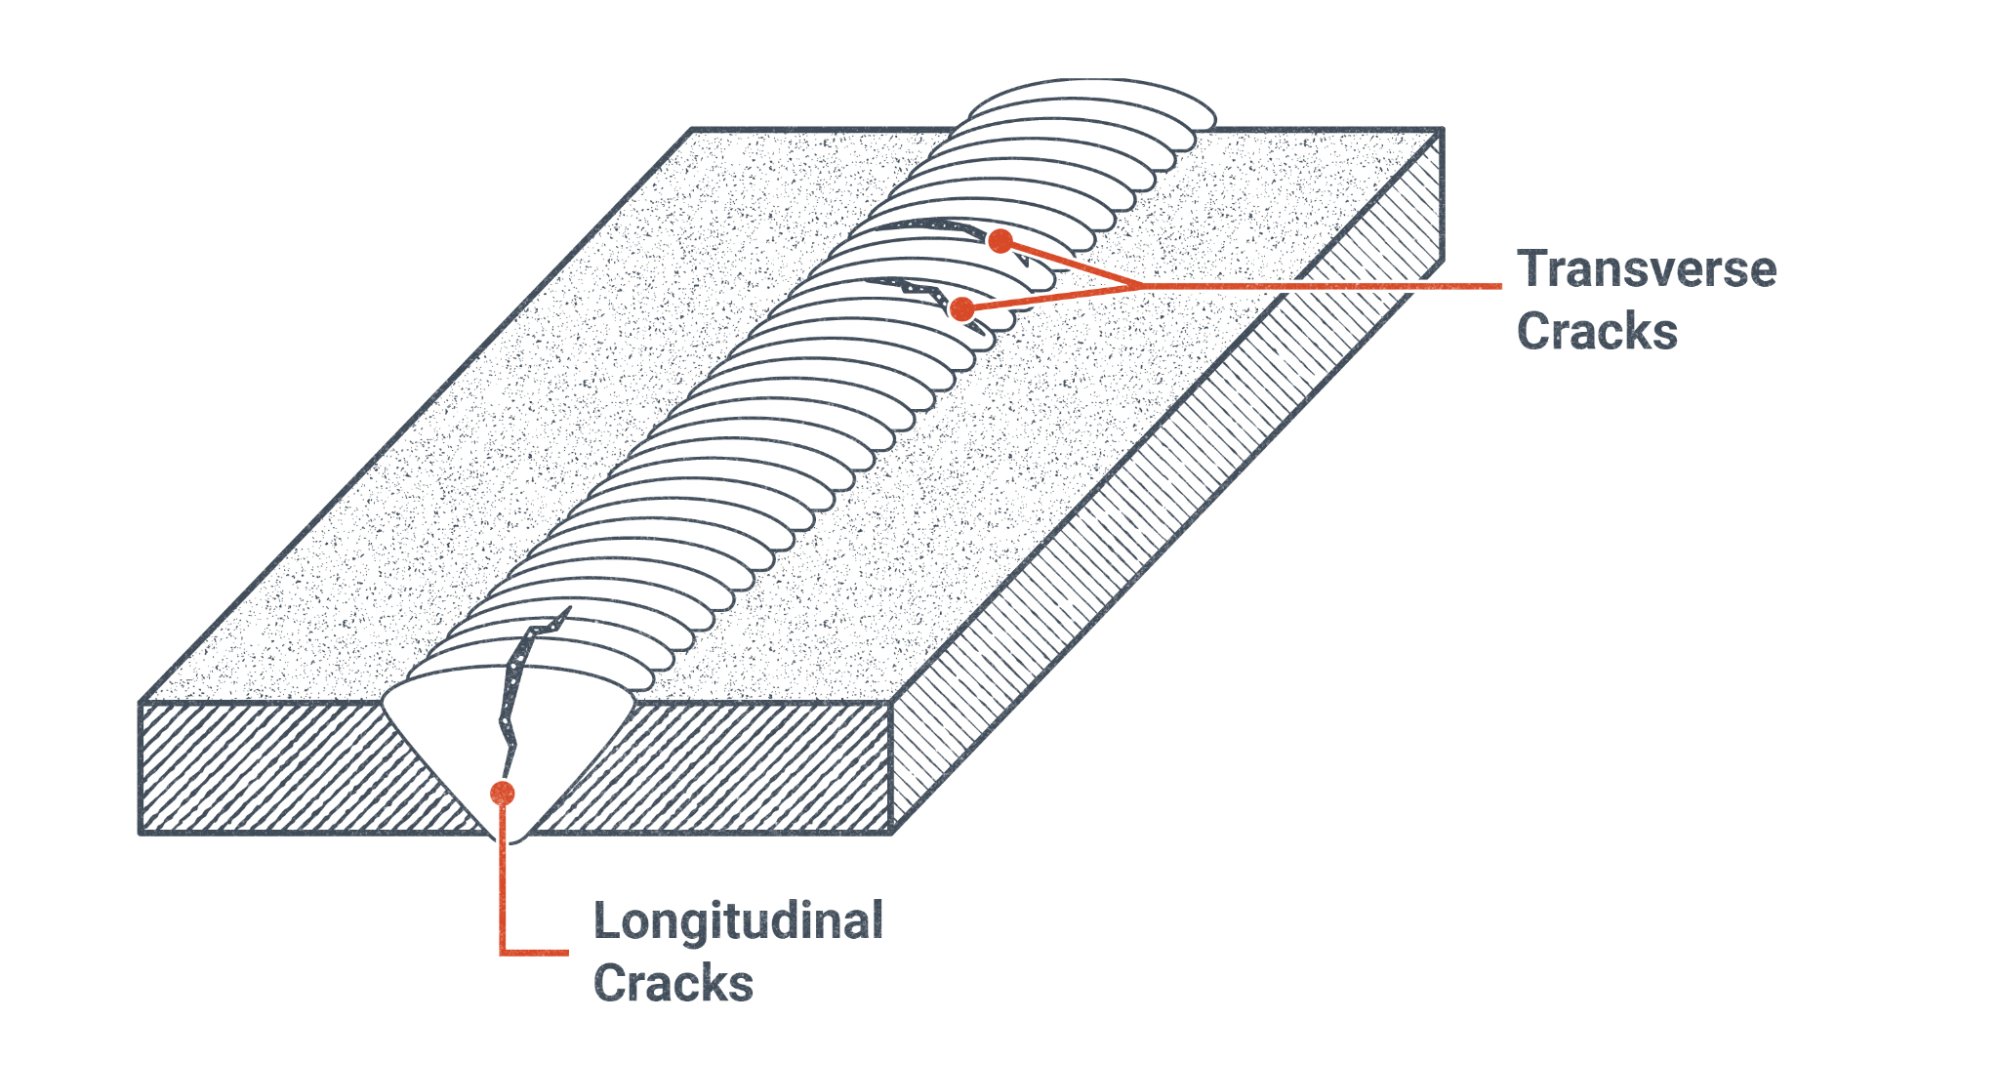
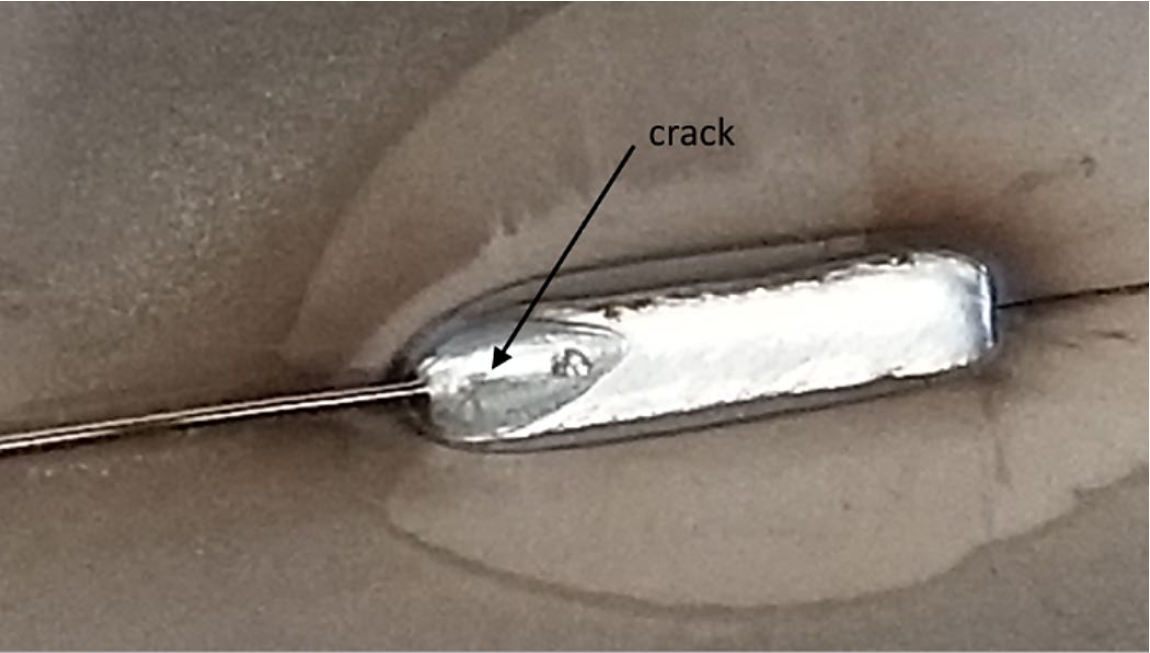
Figure 19.4 shows an illustration of transverse longitudinal cracks. Figure 19.5 shows an example of a crater crack that typically forms in an aluminum weld bead when a crater is not filled in at the end of a weld bead.
Spatter
By itself, spatter (seen in Figure 19.6) is generally not detrimental to a weldment; however, it does show poor workmanship if the welding process used normally doesn’t have spatter. Spatter is usually removed by mechanical means, such as with a grinder.
Spatter does interfere with some testing and must be removed. A great example of this is the need to remove spatter from the surface of the base metal if it will undergo magnetic particle testing. If spatter is on the surface, it will interfere with the test. Likewise, ultrasonic testing usually involves an inspector sliding a transducer across the surface of your weldment. It is important that the transducer sends ultrasonic waves at specified angles into the material being inspected; if spatter exists on the surface of the weldment, the transducer may not be able to be placed properly because the angle of the ultrasonic sound waves would not be correct.
Magnetic particle and ultrasonic tests are described later in this section. If your blueprint shows a welding symbol with MT or UT in the tail, it is best to know whether or not spatter needs to be removed after welding has been performed.
Arc Strikes
An arc strike is important. When welding, welders should always strike an arc within the weld joint that is being welded. The reason for this is more than just cosmetic or for avoiding poor workmanship: When steels are cooled too quickly, they can form martensite, which is brittle.
One discussion that comes up regularly among welders is whether quenching mild steel in a quench tank will result in the formation of martensite. Typically, the amount of base material that exists retains enough heat that your weldment does not form martensite when quenched. However, this is not the case when the base material is at room temperature and a small amount of base material is melted and rapidly cooled following an arc strike. Martensite, depending on the steel, will form a brittle spot, which will likely be the location for crack formation. This is why if you ever accidentally arc strike a gas bottle, that bottle would be immediately taken out of service: it could fail. As a welder, if you arc strike outside of the weld joint, your employer or the welding code may require you to gouge out the arc strike and fill the removed material with a weld.
So why aren’t arc strikes in the weld joint a bad idea? Fortunately, the arc strikes in the weld joint melt when the weld is placed into the joint. The weld will penetrate into the base material by melting and mixing with the base material before solidifying. Any martensite that may have been formed in the arc strike would be destroyed when it melts.
Liquid Penetrant Testing
Liquid penetrant testing (PT) is a multistep process that is used to highlight cracks, porosity, and even arc strikes on a weldment. It works with the application of a very viscous liquid that easily penetrates into the cracks and pores on the surface, which are later highlighted by a developer.
The following general steps are followed when performing PT:
- Thoroughly clean the surface of the weldment being examined.
- Apply the liquid penetrant.
- Allow the liquid penetrant to remain for the prescribed dwell time.
- Remove the excess liquid penetrant from the surface with careful cleaning.
- Apply the developer.
- Wait for any indications to appear through the developer.
These steps would be performed by a trained and qualified inspector for code inspections. PT is available to hobbyists wishing to perform the tests at home.
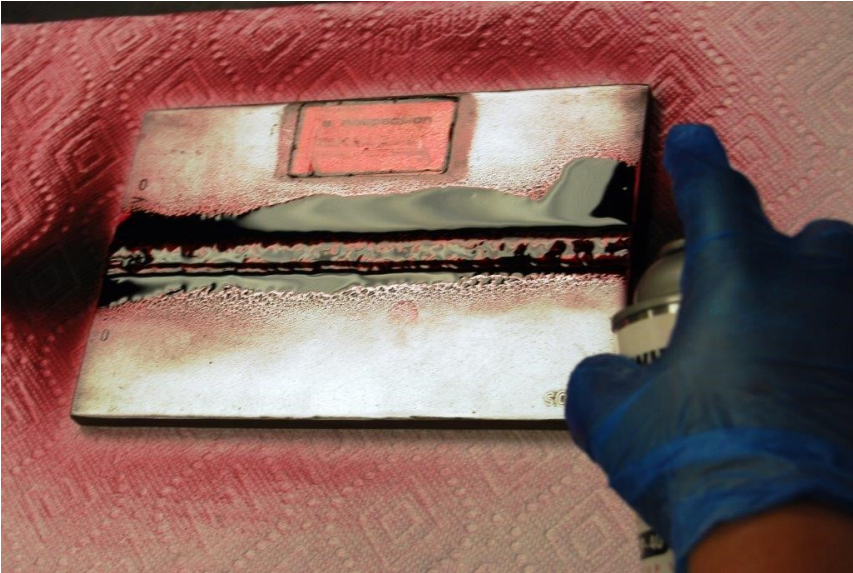
Figure 19.8 shows the application of liquid penetrant to the weldment being inspected. The viscous liquid flows very easily into tight spaces through capillary action. Capillary action is what allows liquids to move against the force of gravity, such as in trees when water moves from the roots to the top of the tree, or in a kitchen sponge stood on end in a shallow bowl of water—over time you would see the sponge absorb the water into areas above the top level of the water in the bowl.
Through capillary action and the viscous nature of the liquid penetrant, the penetrant will seep into the cracks and porosity that is exposed to the surface of the weldment. Capillary action is a relatively slow process and the prescribed dwell time enables the penetrant enough time to seep into any possible surface discontinuities.
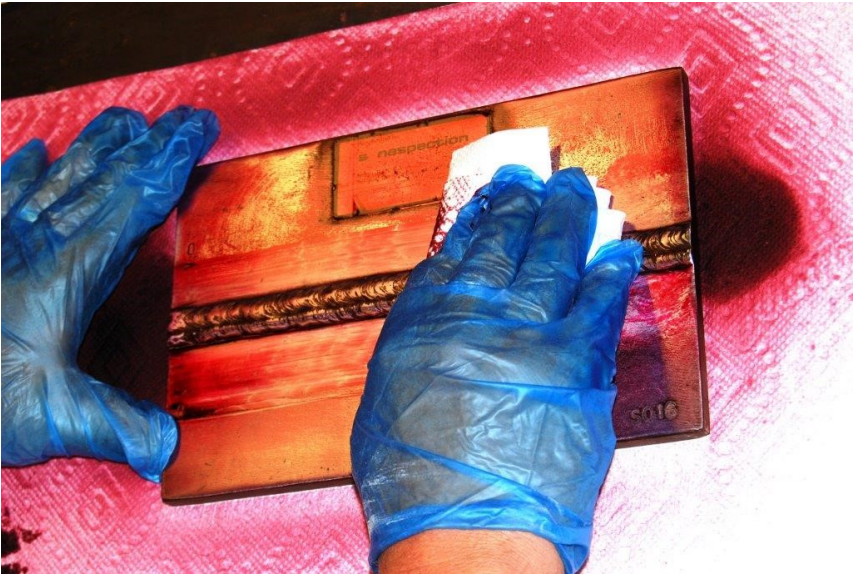
Figure 19.9 shows the inspector carefully cleaning the excess liquid penetrant from the weldment, an important step so there aren’t any false indications once the developer is put on the surface. Once cleaned, only the liquid penetrant that has seeped into the surface discontinuities will be drawn back out to react with the developer.
Wearing gloves during this process is very important, otherwise the liquid penetrant will seep into your porous skin and stain it. There are likely also other health hazards from liquid penetrant that would be discussed on the Safety Data Sheet from the manufacturer of the penetrant.
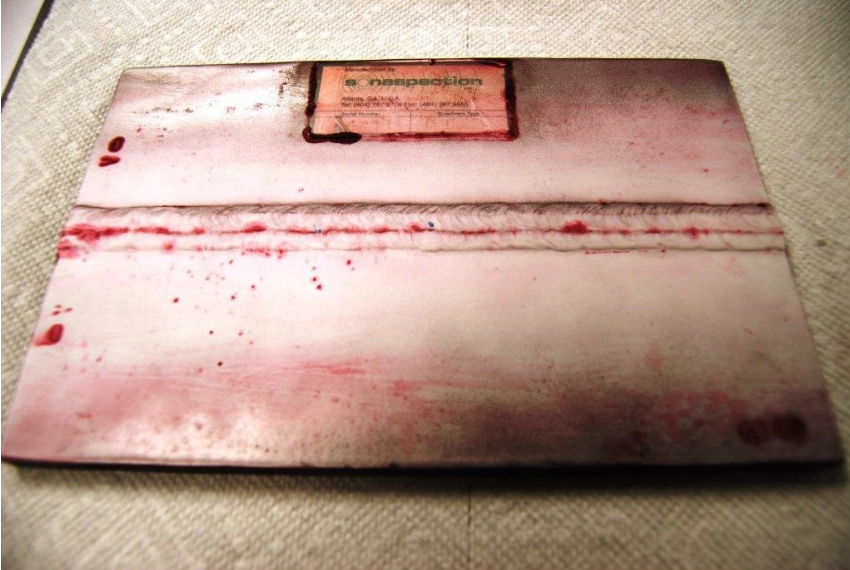
In Figure 19.10, the developer has been applied to the weldment after the surface was cleaned. As an example of this inspection process, Figure 19.10 shows some great indications on the surface of this weldment. The certified liquid penetrant inspector will know what these indications on the surface mean.
For example, it appears that there may be spatter located on the left-hand side of the test surface, below the weld bead. Spatter is a discontinuity but not a defect. If you are performing a PT at home to try it out, it is important to make note of surface features such as spatter so you don’t mistake them for defects later, after the developer has reacted with any remaining liquid penetrant.
Additionally, Figure 19.10 indicates some liquid penetrant may have remained in the lower parts of the weld bead contours. These contours may be acceptable (depending on the welding code), resulting in another set of false indications.
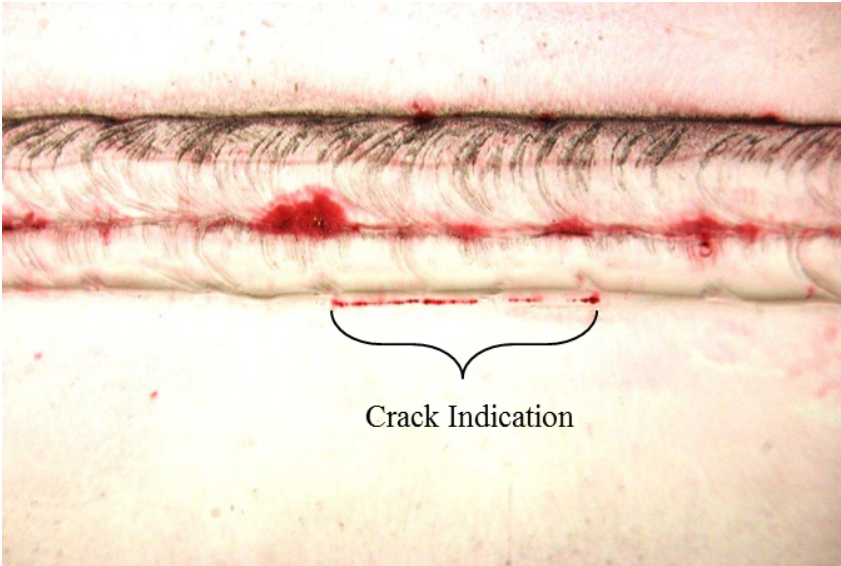
Zoomed in, Figure 19.11 shows a crack that was identified by the liquid penetrant inspector. As the differences between Figures 19.10 and 19.11 reveal, training is important when interpreting the results from PT.
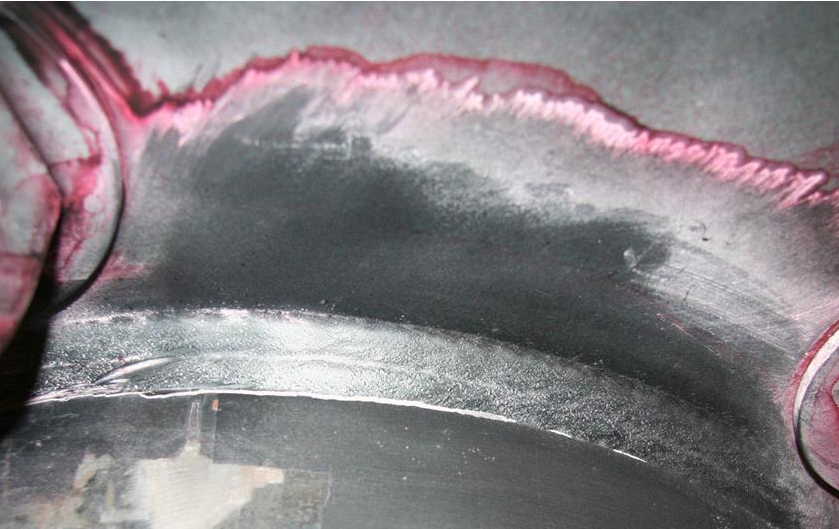
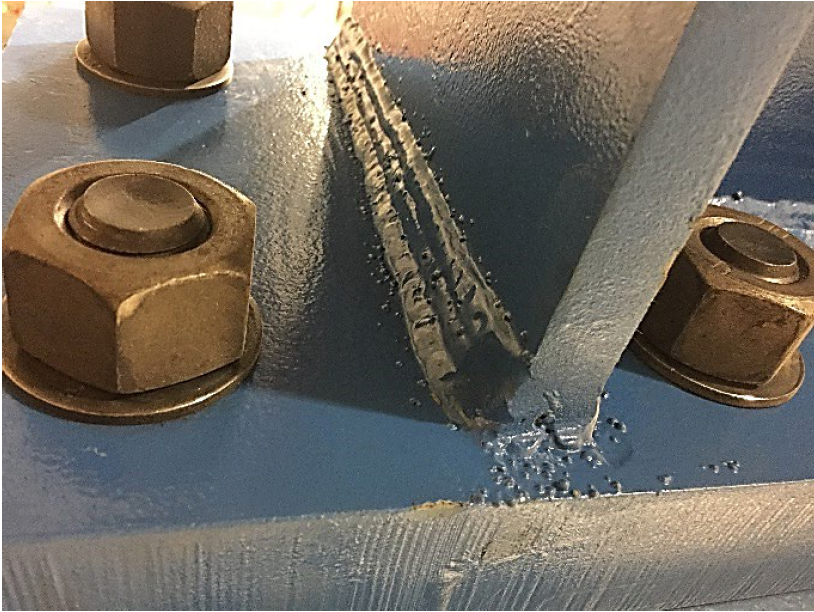
PT is used for many different parts and of all different sizes. Figure 19.12 shows possible crack indications on a part around the bolt holes in this weldment. If this is a cast part or a part with a rough surface, the cracks might be hard to see with the naked eye. The liquid penetrant and the developer provide the contrast that is needed to identify cracks and other discontinuities.
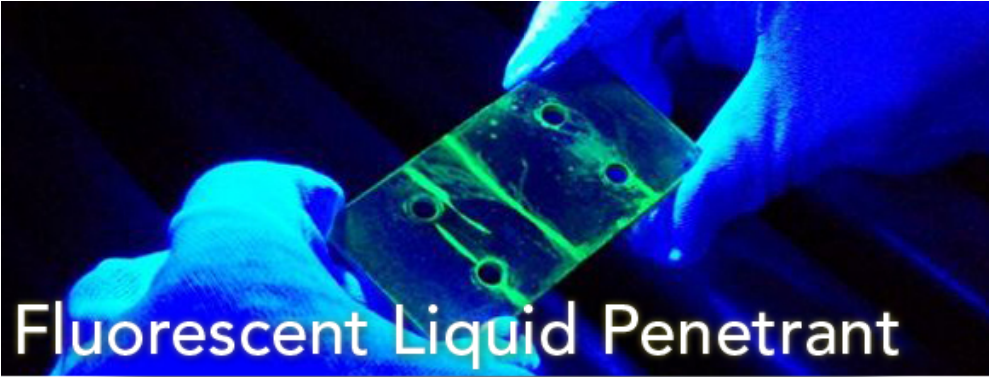
Sometimes even more contrast is required to detect defects in fabrications. Fluorescent liquid penetrant testing provides additional contrast, as shown in Figure 19.13. A black light is used in a dark room to react with the fluorescent liquid penetrant to provide the bright indications for the inspector to interpret. Again, note the gloves being used to protect the inspector from the chemicals; the liquid penetrant would easily dye the inspector’s hands and would be difficult to remove.
Leak Testing
Leak testing (LT) is a process that pressurizes the welded system—typically a piping system, tank, or other vessel—for a given period of time to detect any leaks. Figure 19.17 shows hoses being attached to a piping system to test for leaks prior to the pipes being buried underground.
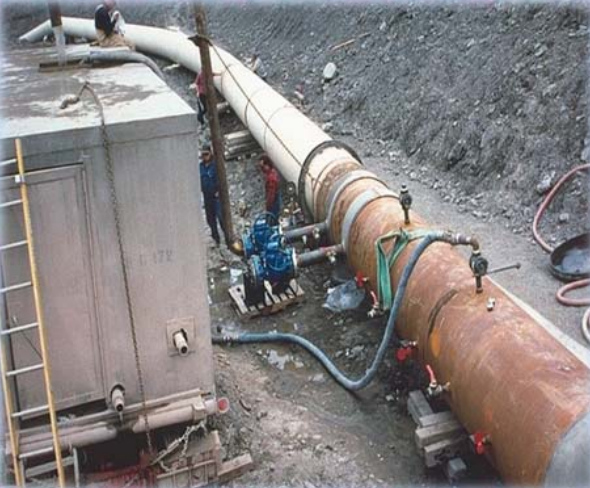
Finding leaks in these pipes prior to their burial makes repairs much easier because no dirt would have to be removed. It is also safer because the pump that is pressurizing the system has a much lower flow rate than the normal flow within the piping system at in-service conditions, meaning that a weld failure during leak testing won’t leak as much volume of liquid. As a comparison, think of your garden hose that you turn off at the valve on the side of a building: the hose is still pressurized, but when you open the other end of the hose only a small burst of water comes out.
Magnetic Particle Testing
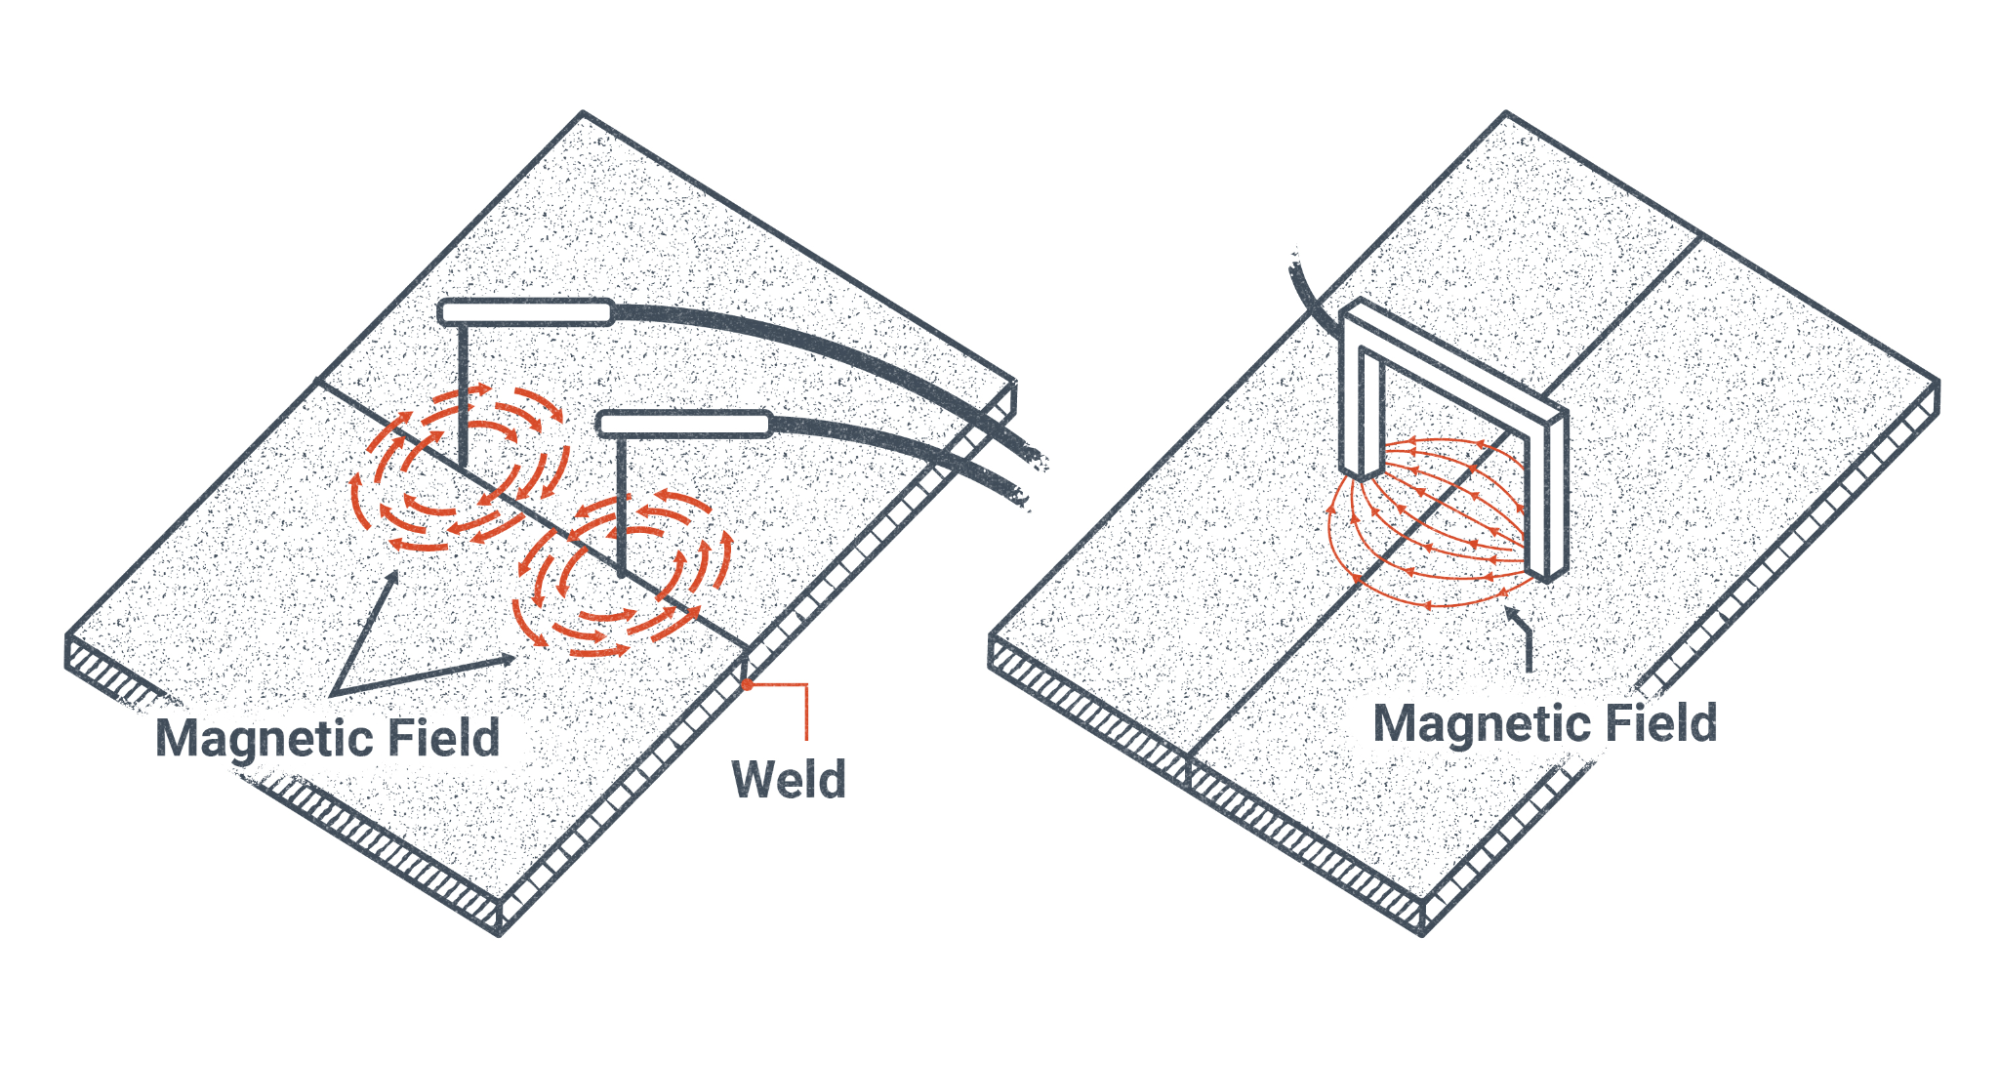
Magnetic particle testing (MT) is a process that uses a magnetic field and fine magnetic particles. The magnetic particles orient themselves in the magnetic field to make discontinuities visible. Figure 19.15 shows different types of prods inducing magnetic fields around a weld.
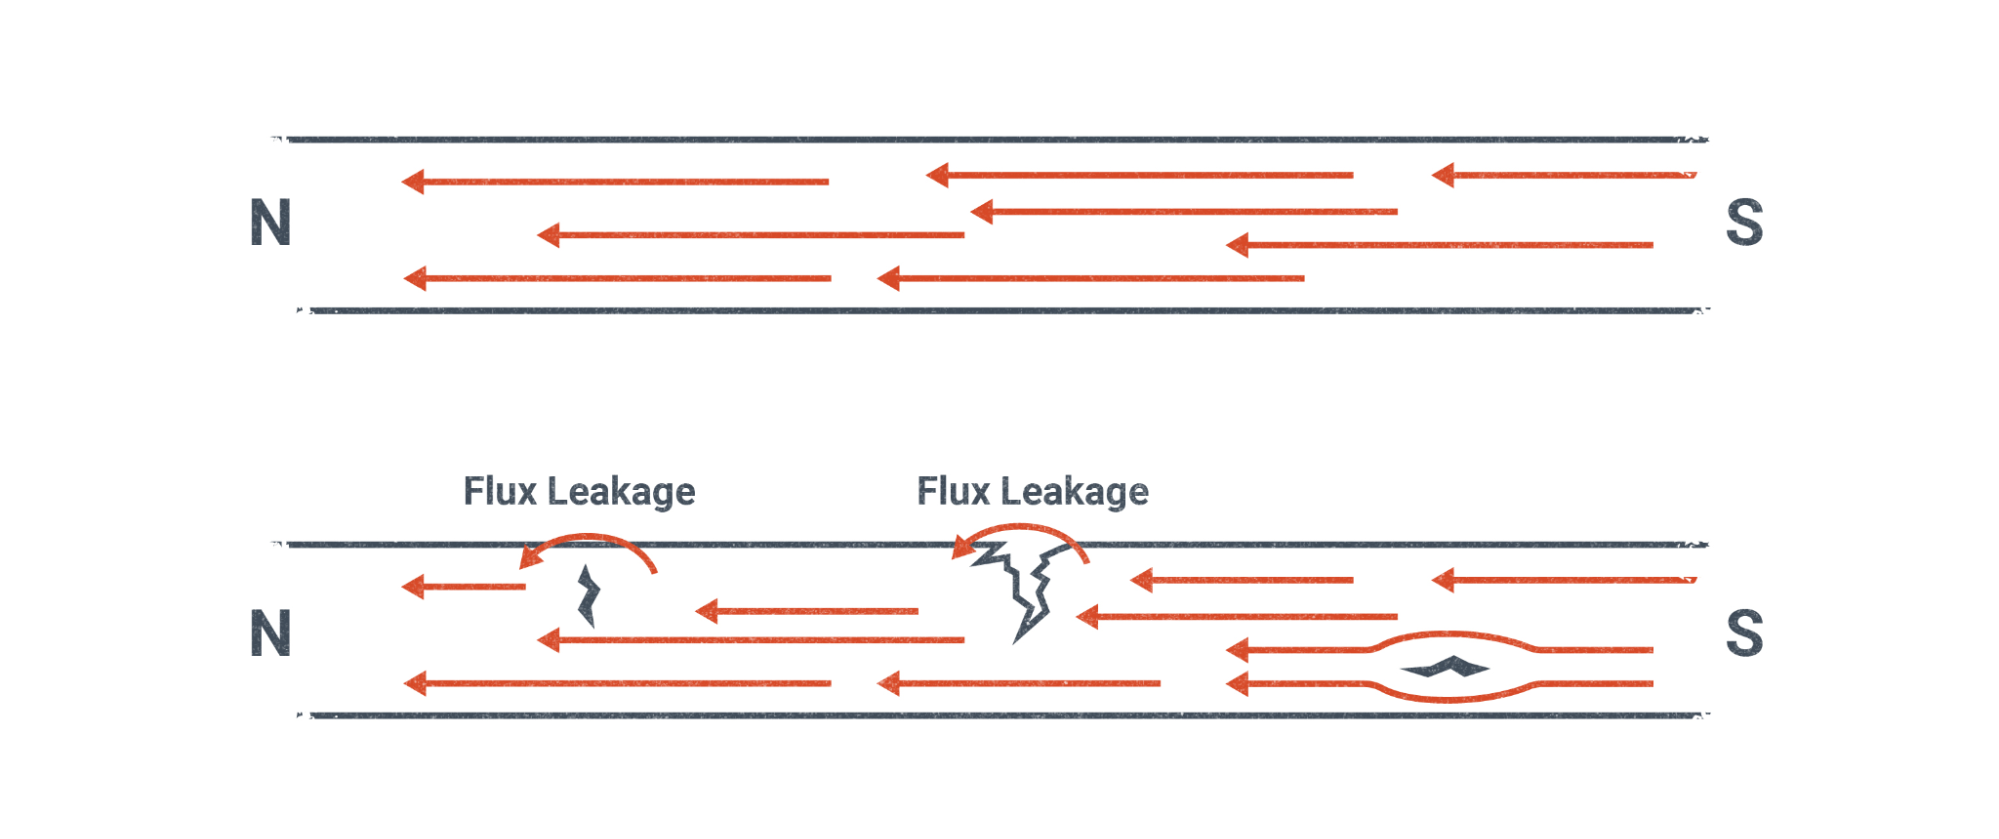
MT can only be performed on magnetic materials to be effective. Because defects within magnetic materials change the direction of the magnetic field, the magnetic particles located on the surface of the weldment will move and align themselves in a particular pattern due to the shape of the discontinuity. Only discontinuities that are not parallel to the magnetic field are detectable (see the right side of Figure 19.16).
In practice, the magnetic particle inspector applies the magnetic particles from a bottle in a manner similar to applying baby powder from a bottle. Figure 19.17 shows the inspector actively applying the iron powder from a red bottle in their right hand while holding the yoke in their left hand. The massive fillet weld along the T-joint that is being illuminated by the flashlight in the picture is likely being inspected.
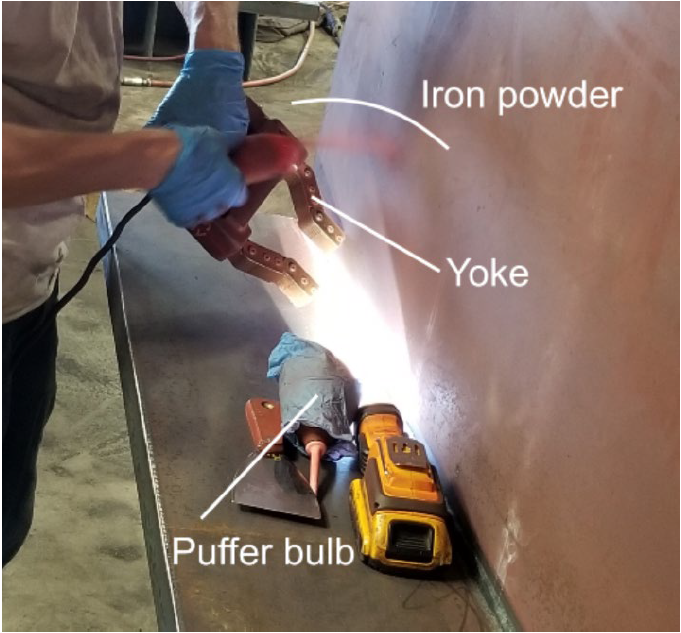
The magnetic particle inspector will take great care to gently blow the excess magnetic particles with a puffer bulb. If the inspector is too aggressive with the puffer bulb, they will blow too many magnetic particles away and possibly miss an indication of a discontinuity. And if they don’t blow away enough particles, then the indication of a discontinuity may be masked.
Eddy Current Testing
Eddy current testing (ECT) is a process that induces a current into the weldment being inspected. Figure 19.18 shows an electric coil with an alternating current (AC) signal applied to it. Alternating current is current that changes direction regularly. The electricity that is supplied from the wall outlets in your home or at school are 60 Hz AC, meaning the signal has 60 cycles per second with two changes in direction per cycle for 120 changes per second.
You may have heard the term electromagnetism before. This term refers to the fact that electricity and magnetism are forces that act together. To be super technical about it, electricity and magnetism are two effects that result from an electric charge; magnetism results from a moving charge while electricity can occur with both a moving and nonmoving charge. For moving charges think of electricity in a wire and for nonmoving charges think of static electricity or a disconnected charged battery.
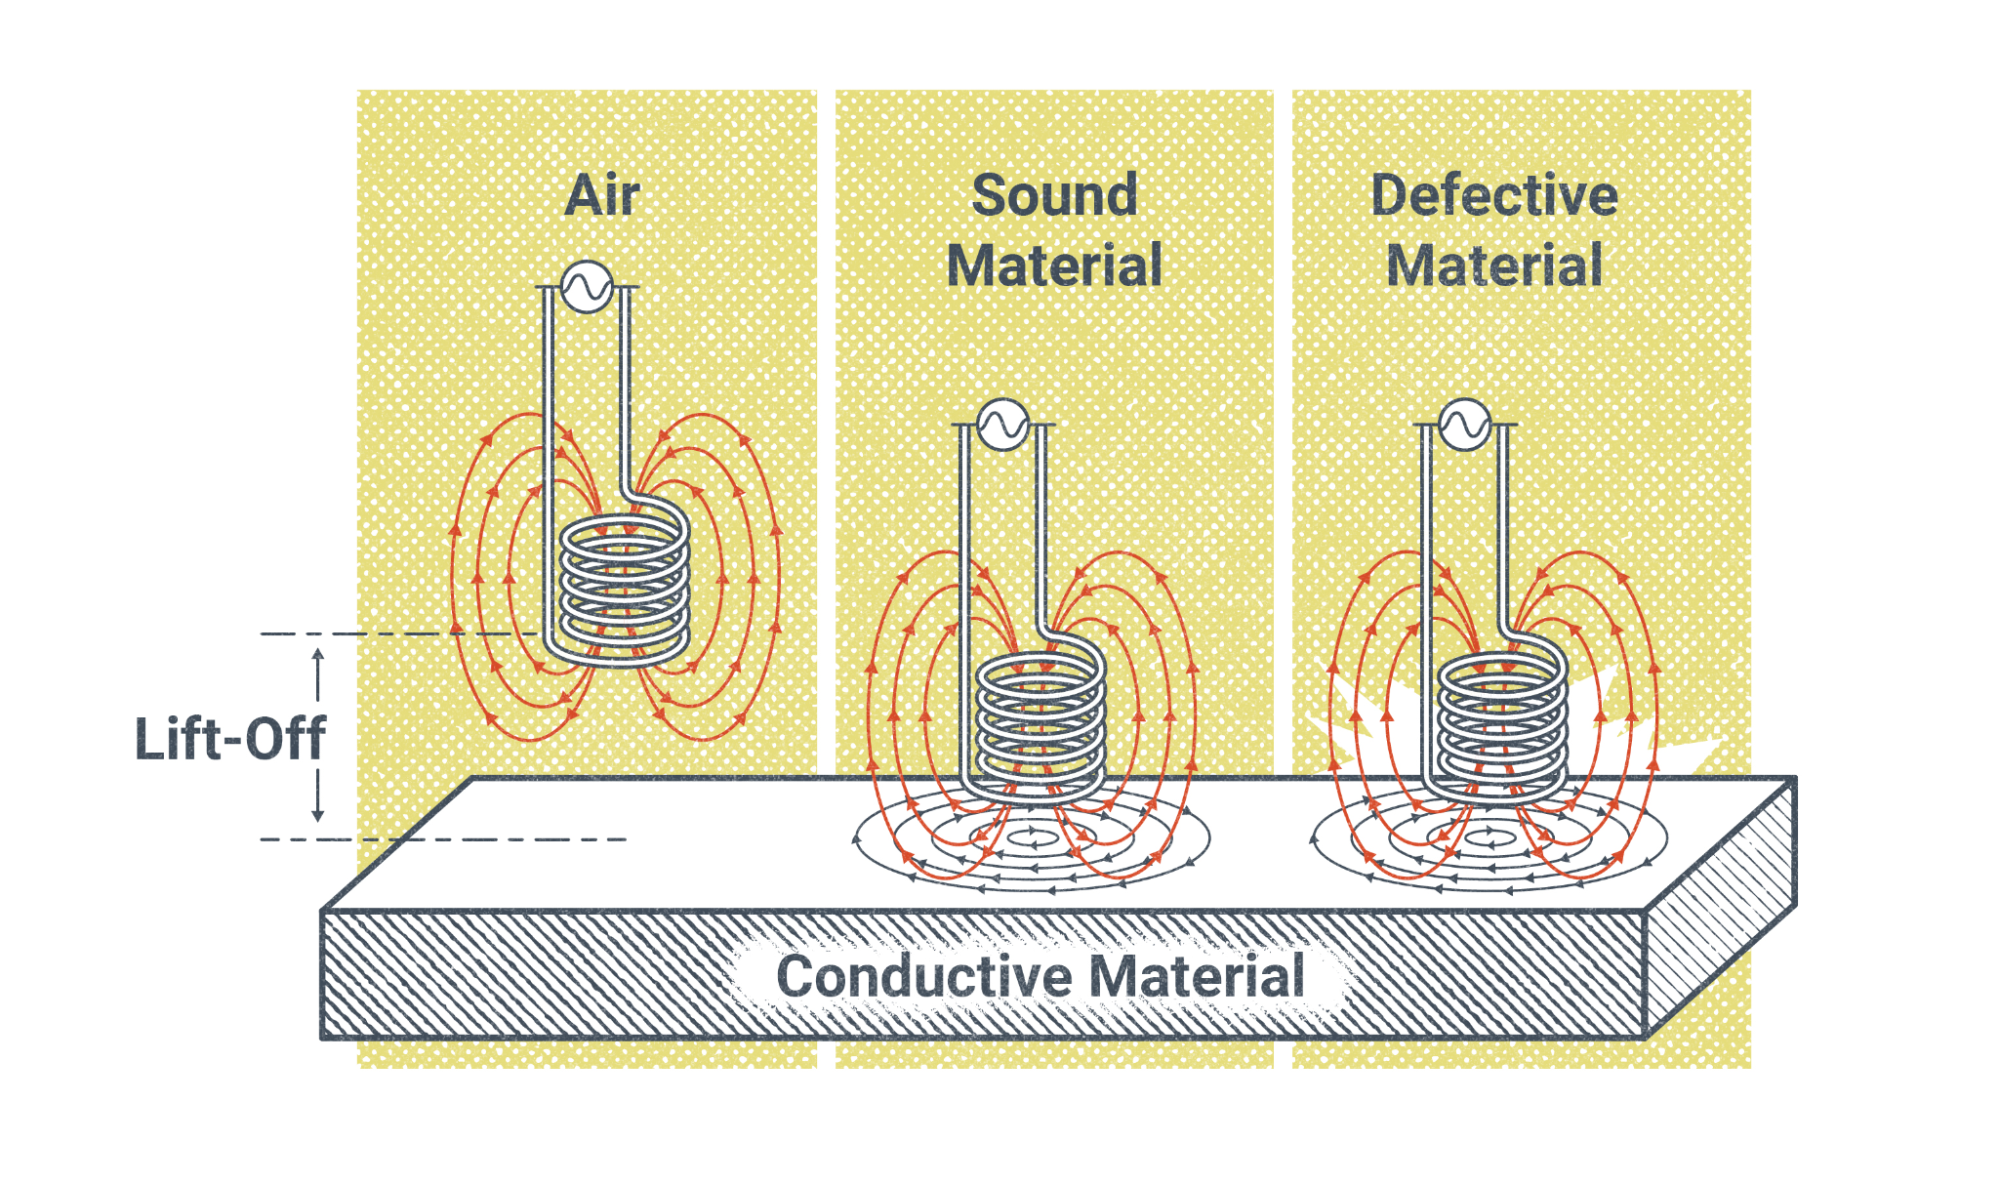
The left side Figure 19.18 shows the magnetic field from the coil when it is too far away from the conductive material to induce a magnetic field. In the middle of the figure, the coil is close enough to induce a magnetic field with a uniform field because there are no discontinuities. However, the position on the right side of the figure has a disturbed magnetic field.
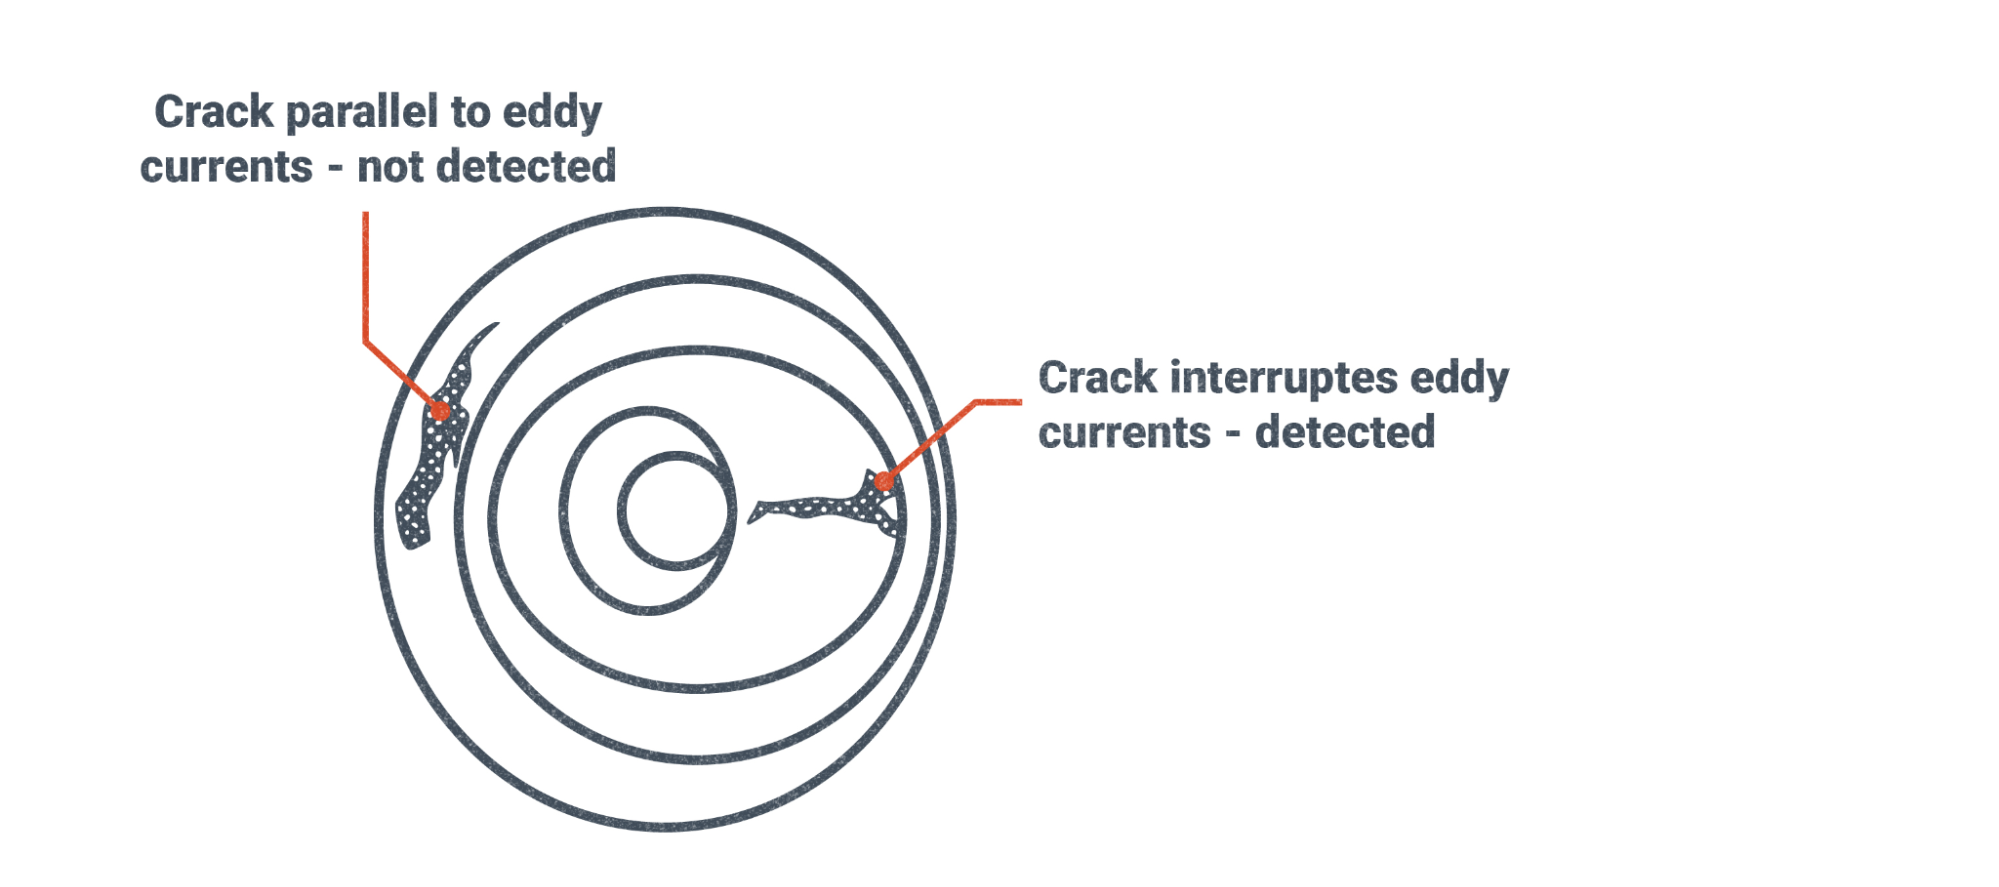
Similar to MT, ECT can only detect discontinuities that are not parallel to the lines of the magnetic field. Discontinuities that are parallel, or mostly parallel, to the lines of the magnetic field do not produce a strong enough signal to detect. Figure 19.19 shows the disturbed lines of magnetic force due to the presence of the discontinuities. If the discontinuities did not exist, then the lines of magnetic force in the figure would be concentric circles. Notice that the crack that is perpendicular to the magnetic lines interrupts them by pushing them further apart as they go around the crack while the crack parallel to the magnetic lines does not affect the magnetic lines enough to be noticeable.
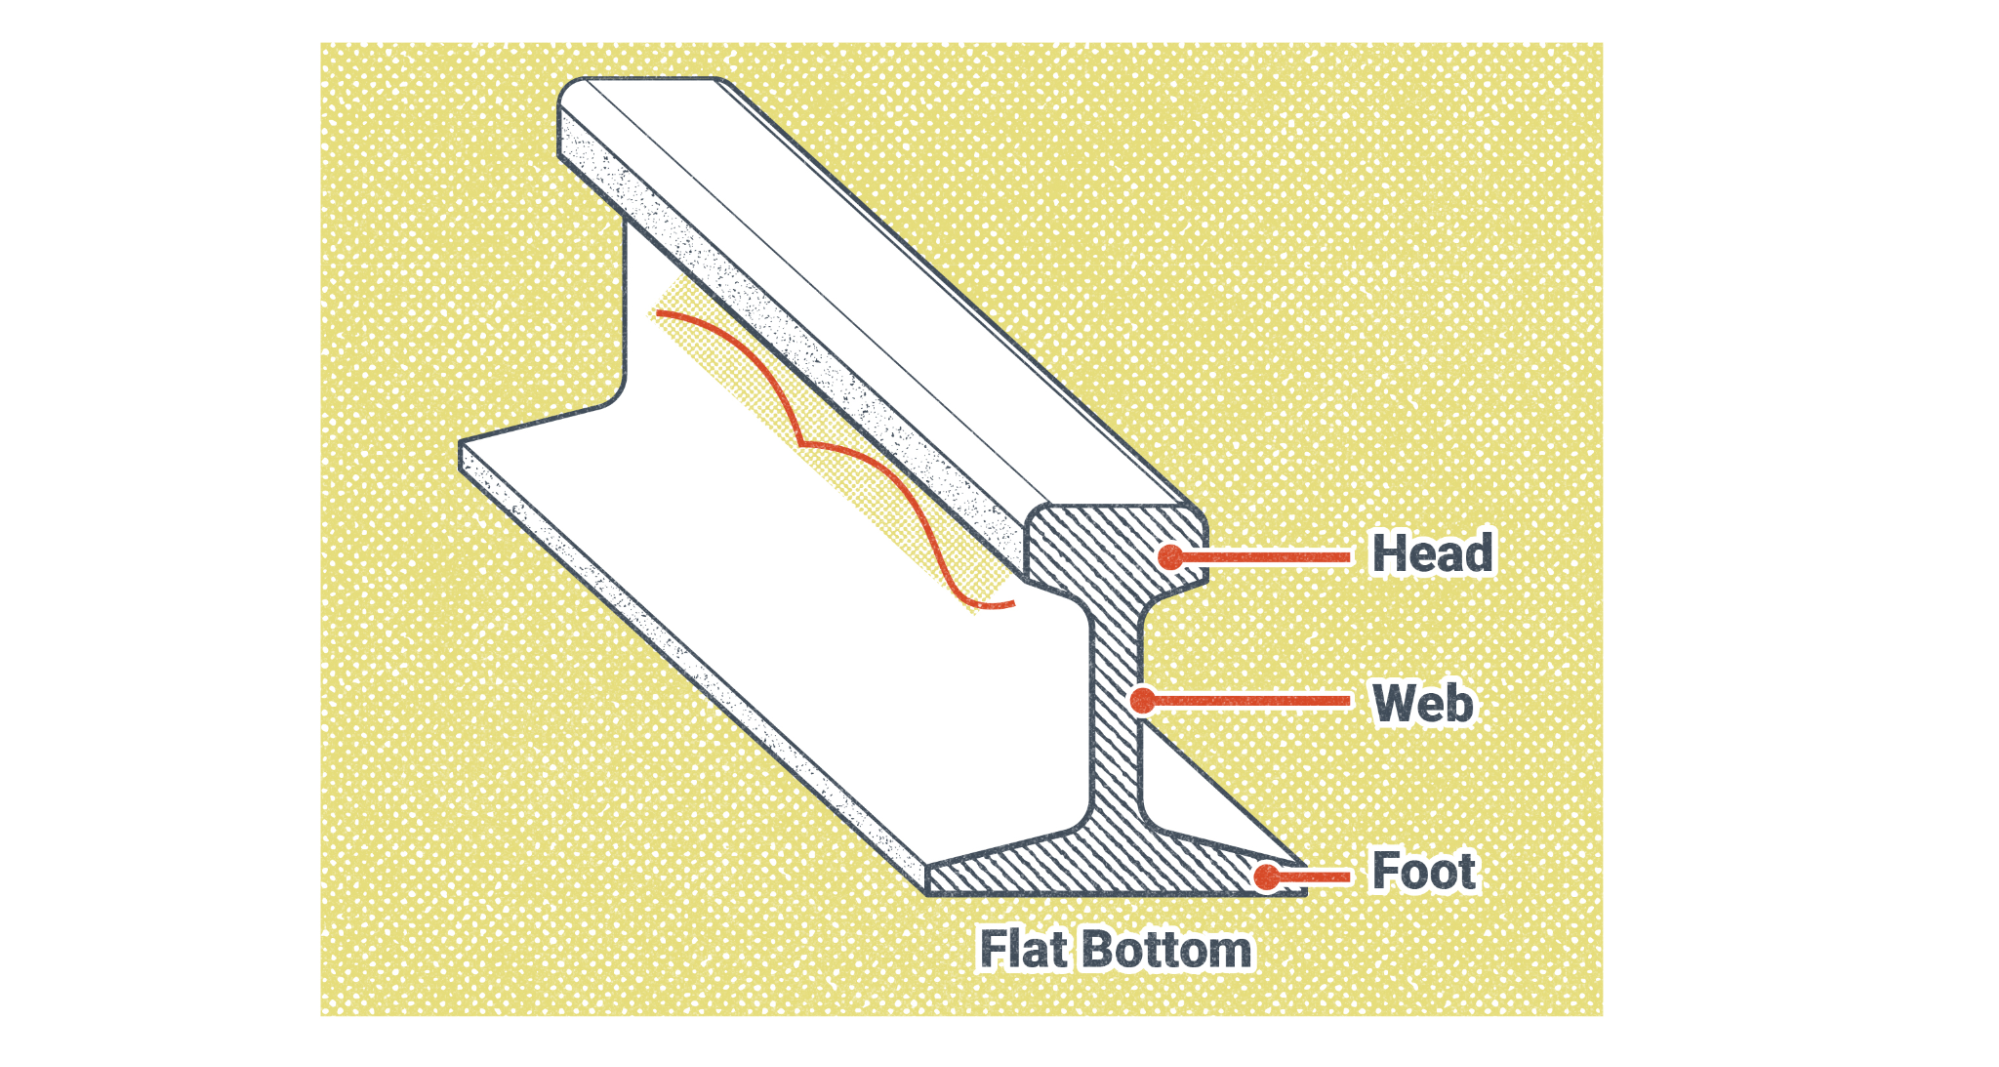
Next we’ll look at Figure 19.20, which illustrates a crack that exists on a small piece of a railroad rail. Figure 19.21 is a composite of multiple pictures that show close up pictures of the rail cracks and a digital readout of the indications of the cracks.
Before we look at Figure 19.21 in detail, let’s cover why there are two screen images shown, one labeled “Real part of impedance” and the other “Imaginary part of impedance.” Mathematically, electromagnetism has real and imaginary values when measuring it. We are all familiar with real numbers, such as whole numbers, decimals, and fractions. We use them in welding settings on our machines, such as 95 amps, or 24 volts. For engineers and technicians working with electromagnetism it is easier to describe electromagnetism with a complex number, meaning a number with a real and imaginary part than to describe it using amperage, voltage, capacitance, and inductance.
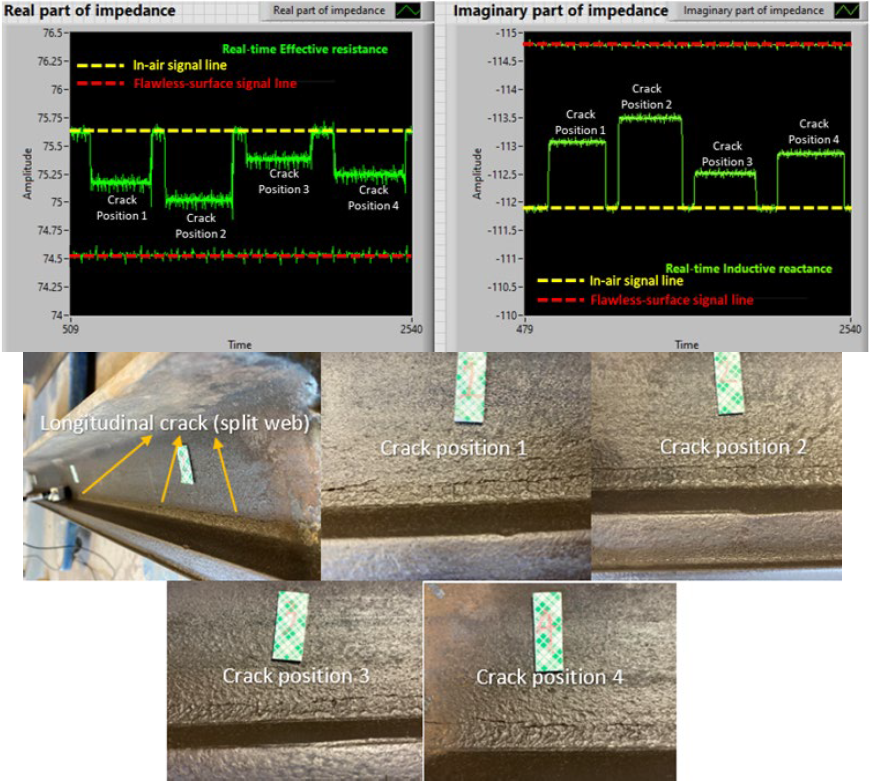
An in depth discussion of complex numbers is beyond the scope of this chapter, but it was worth mentioning in case you are curious about the screen images shown in Figure 19.21. Capacitance is the resistance to a change in voltage while inductance is the resistance to a change in current. Inductance is a setting on your welding machine to control spatter when welding with GMAW in the short circuit transfer mode. By increasing the inductance you reduce the amount of spatter that occurs when the wire short-circuits with the workpiece. Turning up the inductance too much will cause stubbing where the wire hits the workpiece and pushes your welding gun away.
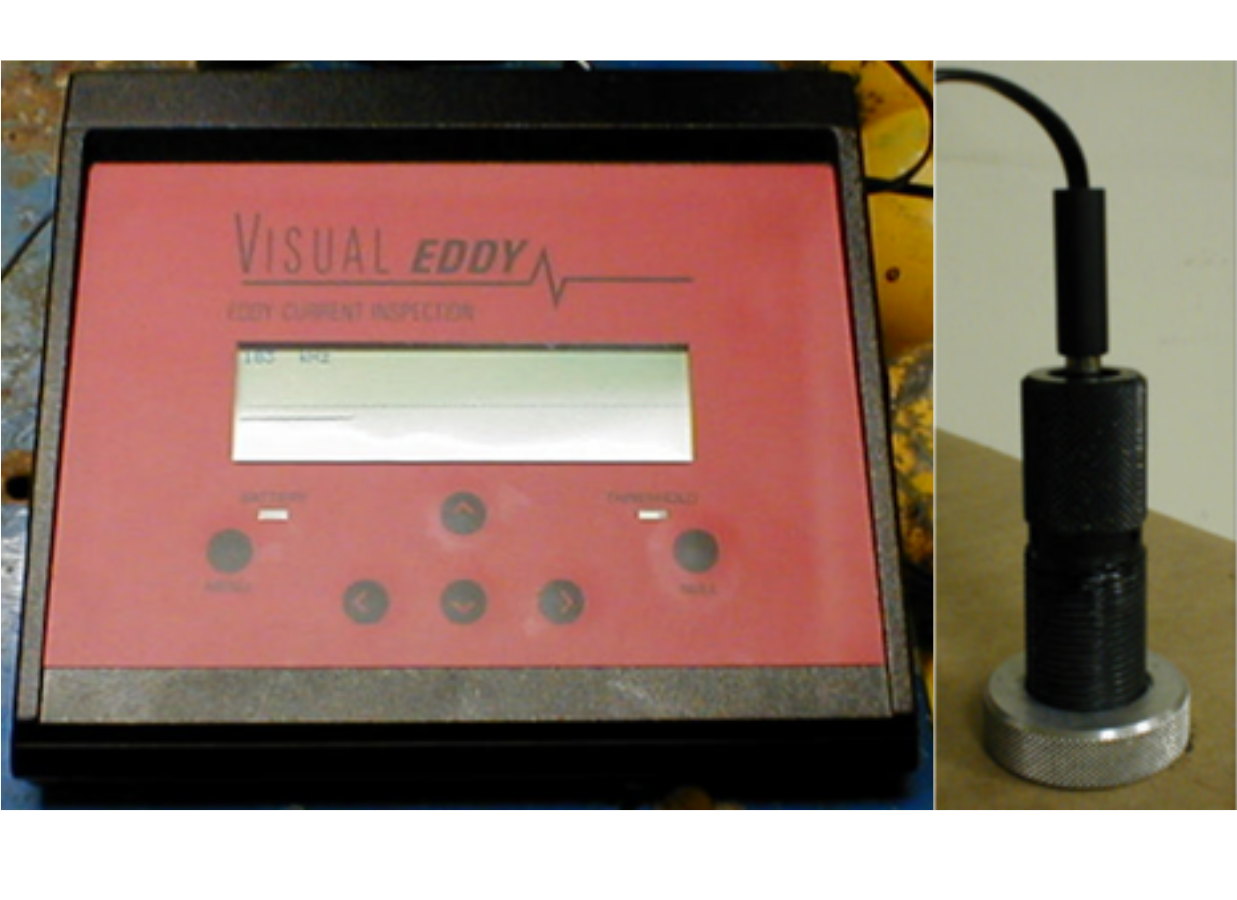
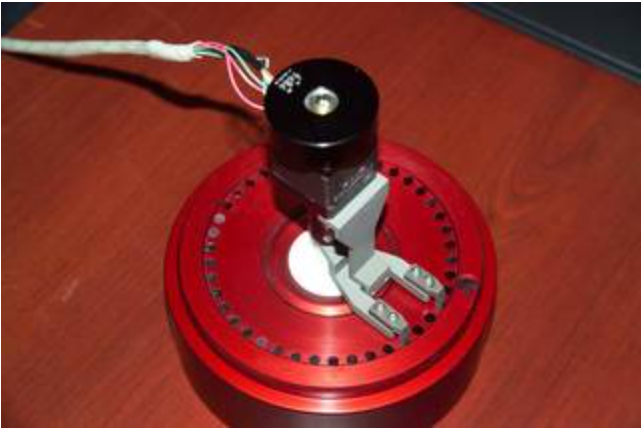
Figure 19.22 shows another example of a digital readout of an ECT with a flaw being indicated on the screen (left-hand side) and an eddy current probe (right-hand side). Figure 19.23 shows another type of eddy current probe that you may see in the field.
Radiographic Testing
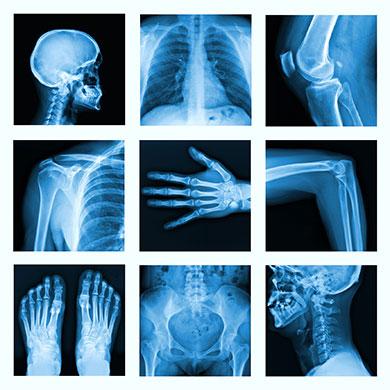
Radiographic testing (RT) uses X-rays to penetrate weldments so inspectors can see what is normally not visible to the naked eye. Figure 19.24 shows the powerful imagery X-rays can provide of the human body.
An RT works by positioning your weldment between the X-ray source and a piece of film or digital sensor.
Note that as technology changes and adapts, so does radiography. The market for analog film for radiography is mostly medical, but if the medical field transitions to all-digital radiography, the cost of film would skyrocket and, likely, welding inspectors would switch to digital radiography as a result. Figure 19.25 shows analog film under the weldment, but in digital radiography a digital sensor would replace the film.
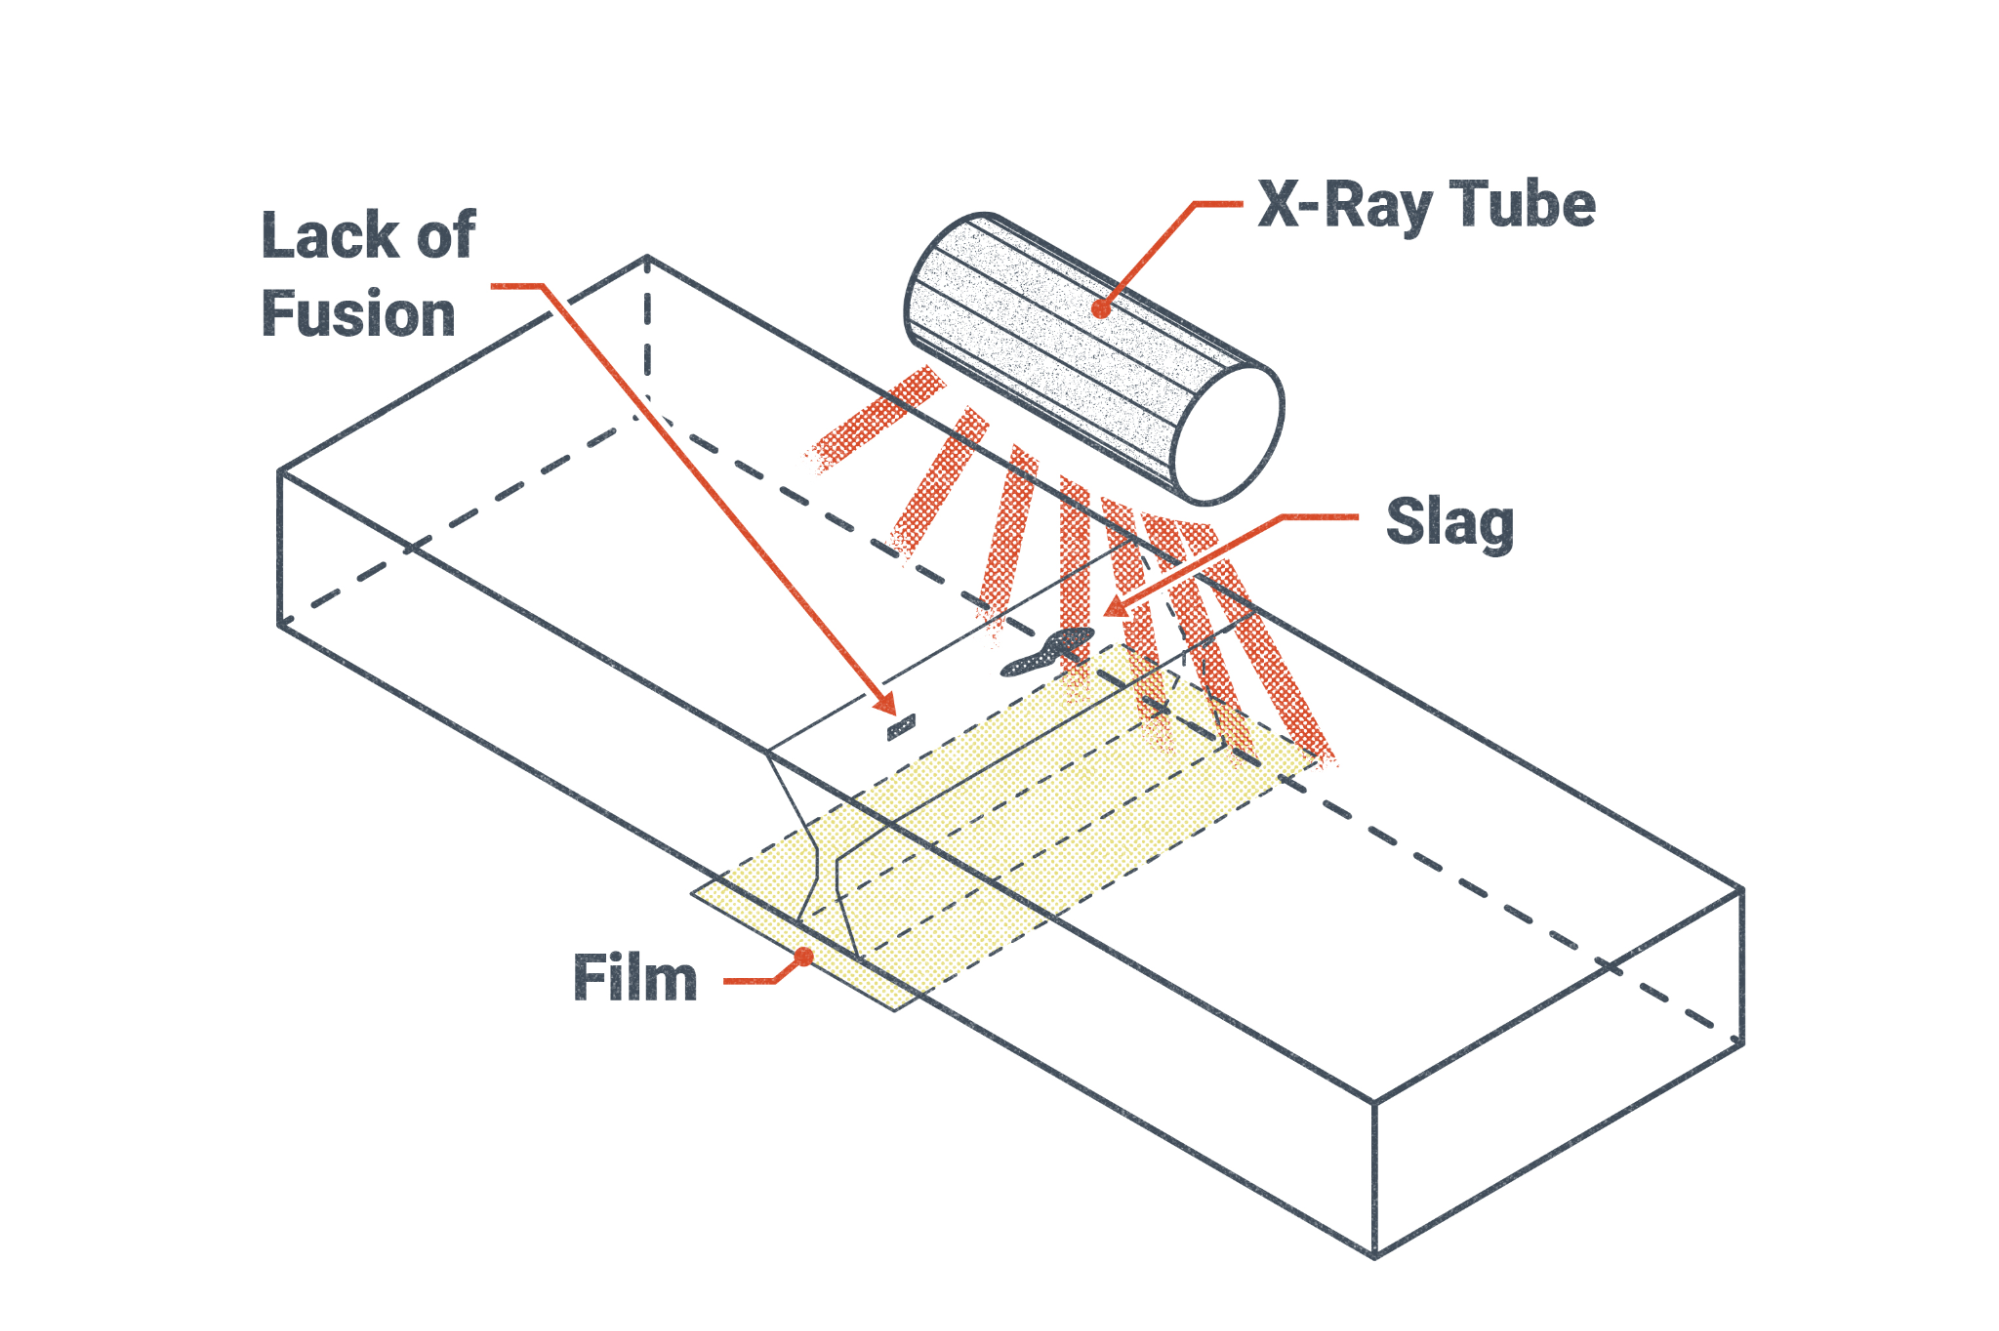
An actual image of an X-ray tube like the one used in Figure 19.25 is found in Figure 19.26.
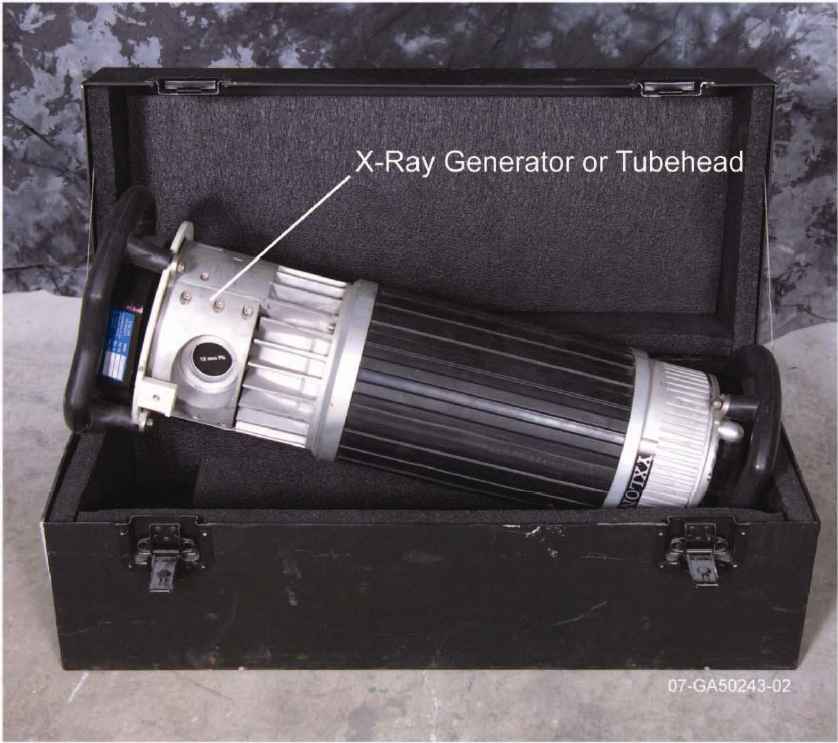
For safety, the X-ray generator has a lead plug to protect against the X-rays when not in use. These generators should only be handled by qualified personnel or personnel being trained under the supervision of a qualified inspector because they can generate a lethal X-ray dose. Any time radiation is involved as an occupational hazard, the term “as low as reasonably achievable” (ALARA) is used. ALARA is achievable through decreased exposure time and increased distance to or from the radiation source.
In practice this means that only the personnel who must be near the X-ray generator should be near it for as short a time as possible. Otherwise, personnel will make as much distance between themselves and the source of radiation as possible. This is why the technician leaves the room when you get a medical X-ray; you getting a handful of X-rays in your lifetime is much different from the technician getting exposed to a dozen X-rays per working day.
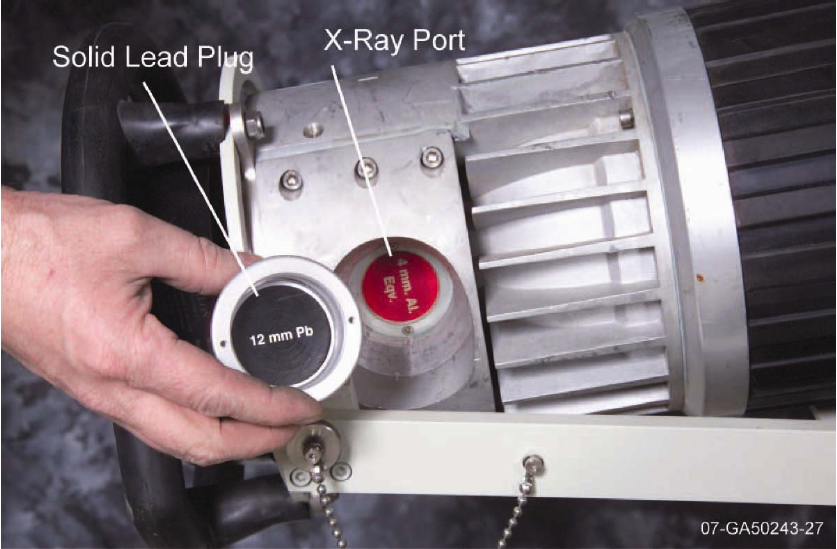
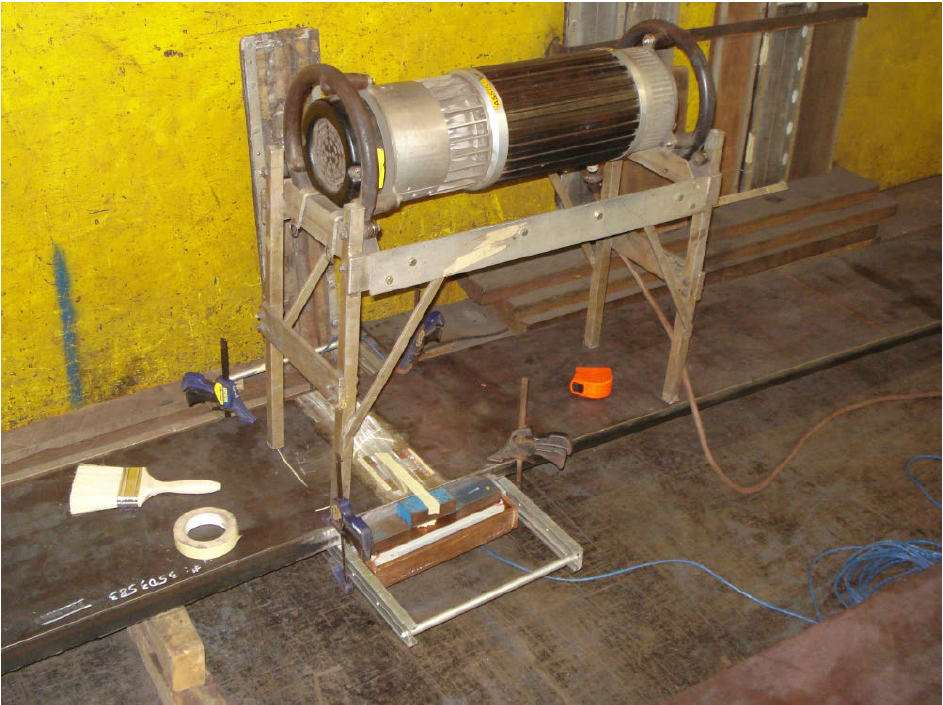
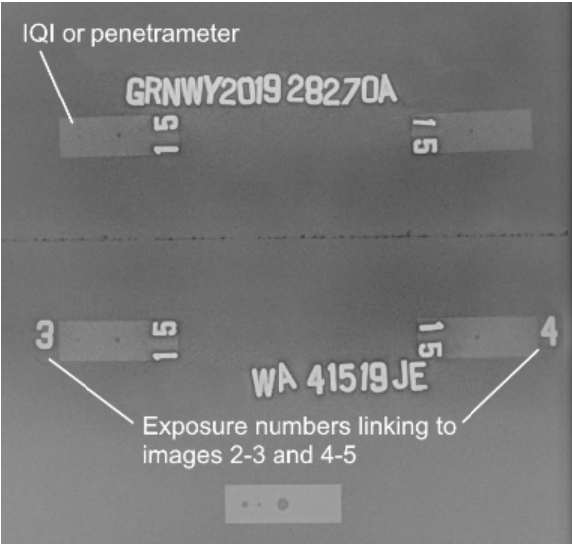
Figure 19.28 shows a radiographic inspection of a weldment. You can see the weldment is in between the X-ray source and a plate of film that is underneath the weld. As part of the inspection process, Image Quality Indicators (IQIs) are used to ensure that the radiograph can detect a minimum required detail. If the letters of the IQI are not readable, the radiographic inspection is not acceptable and must be redone. These IQIs can be seen in Figure 19.29.
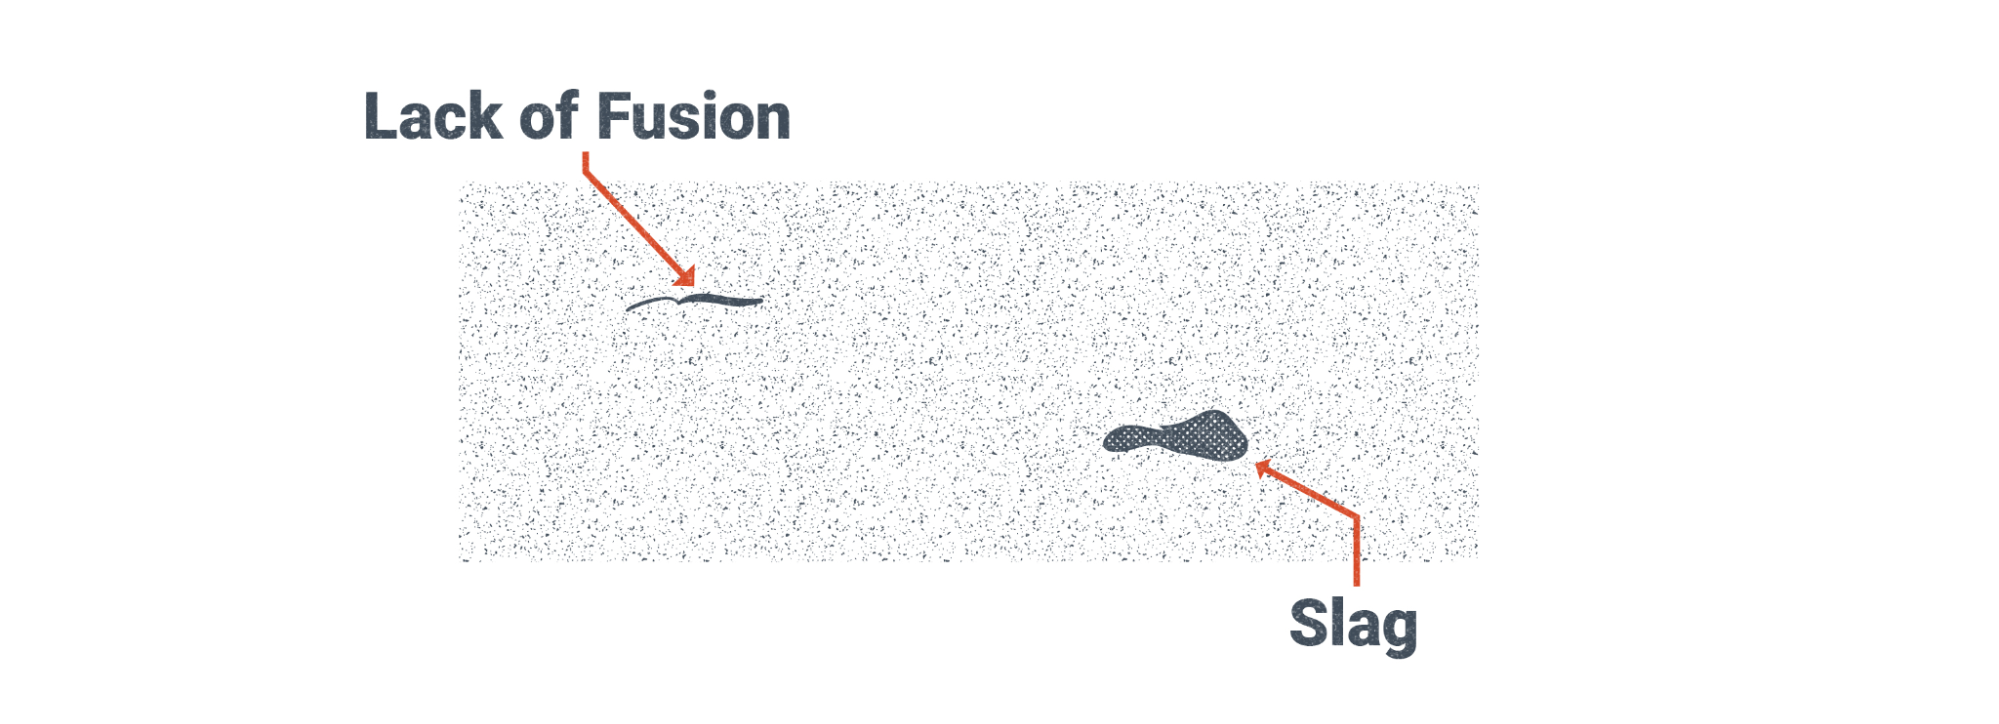
Figures 19.30 and 19.31 show illustrations of what welding discontinuities would look like in RT. Trained welding inspectors know what to look for when they are inspecting weldments.
Ultrasonic Testing
Ultrasonic testing (UT) is a technology that was adapted from the medical field, similarly to RT. Instead of using radiation, such as X-rays, UT uses sound waves, such as ultrasonic waves. The transducers shown in Figure 19.32 and 19.33 both sends and receives the sound waves
There are many different types of UT, including immersed UT where the specimen being inspected is submerged in a pool of water and the transducer is located away from the surface of the weldment. There is also UT where there is an air gap between the transducer and the weldment being inspected. These two forms of UT are beyond the scope of this chapter; for the discussion in this chapter, we will stick to the UT depicted in Figure 19.32.
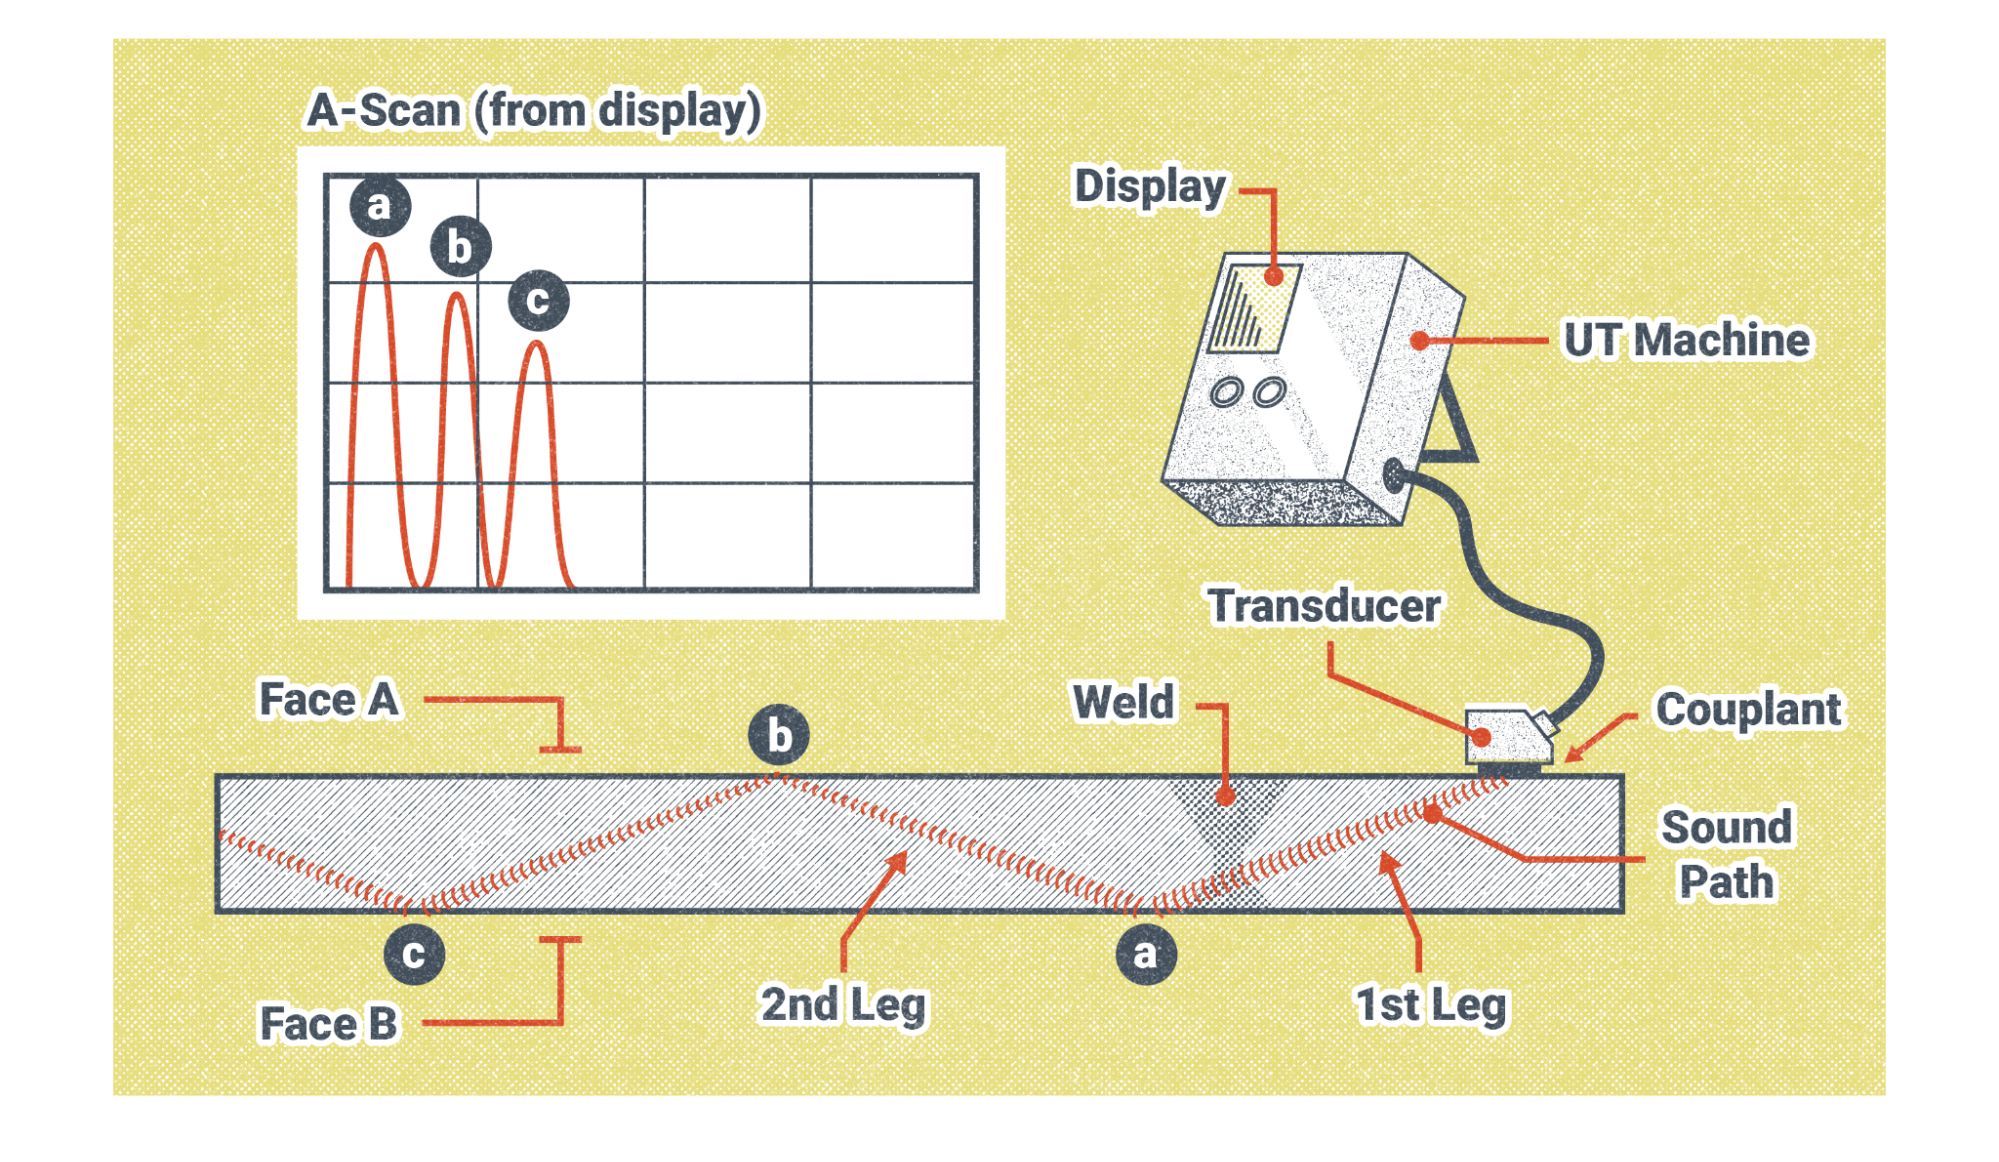
Figure 19.32 identifies a couplant, which is usually in the form of a gel that is applied to the surface of the weldment. This couplant ensures that the transducer is “coupled” to the weldment in a way that allows sound waves to pass through the transducer and into the weldment. If an air gap existed between the transducer and the weldment due to a unlevel surface, the air gap would interfere with the results of the UT inspection.
After the couplant is applied, the inspector slides the transducer into position. This sliding action requires a smooth surface generally free of spatter. Remove spatter prior to UT if requested or required.
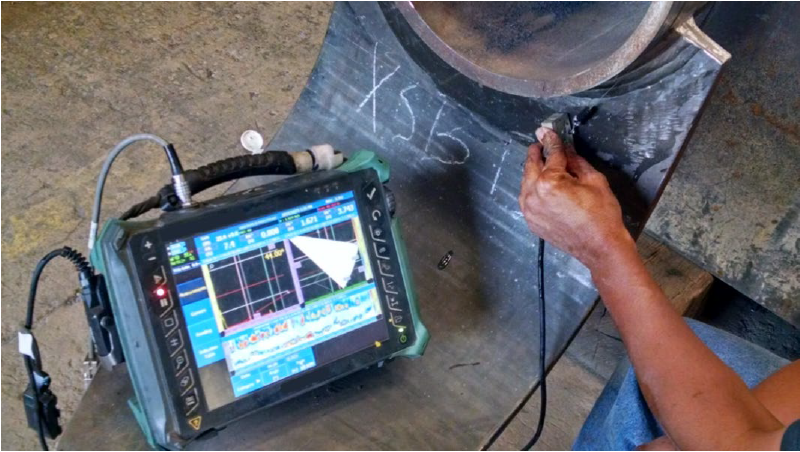
Next the inspector holds the transducer with their fingers and moves it around while watching the display (see the opening chapter image and Figure 19.37). If you have watched on a TV show or been in a doctor’s office when an ultrasound was being performed you, are familiar with the technician moving the transducer around on the patient’s body as they watch the image on the screen. You may even remember the gel couplant that was applied to the skin. The process is the same in UT.
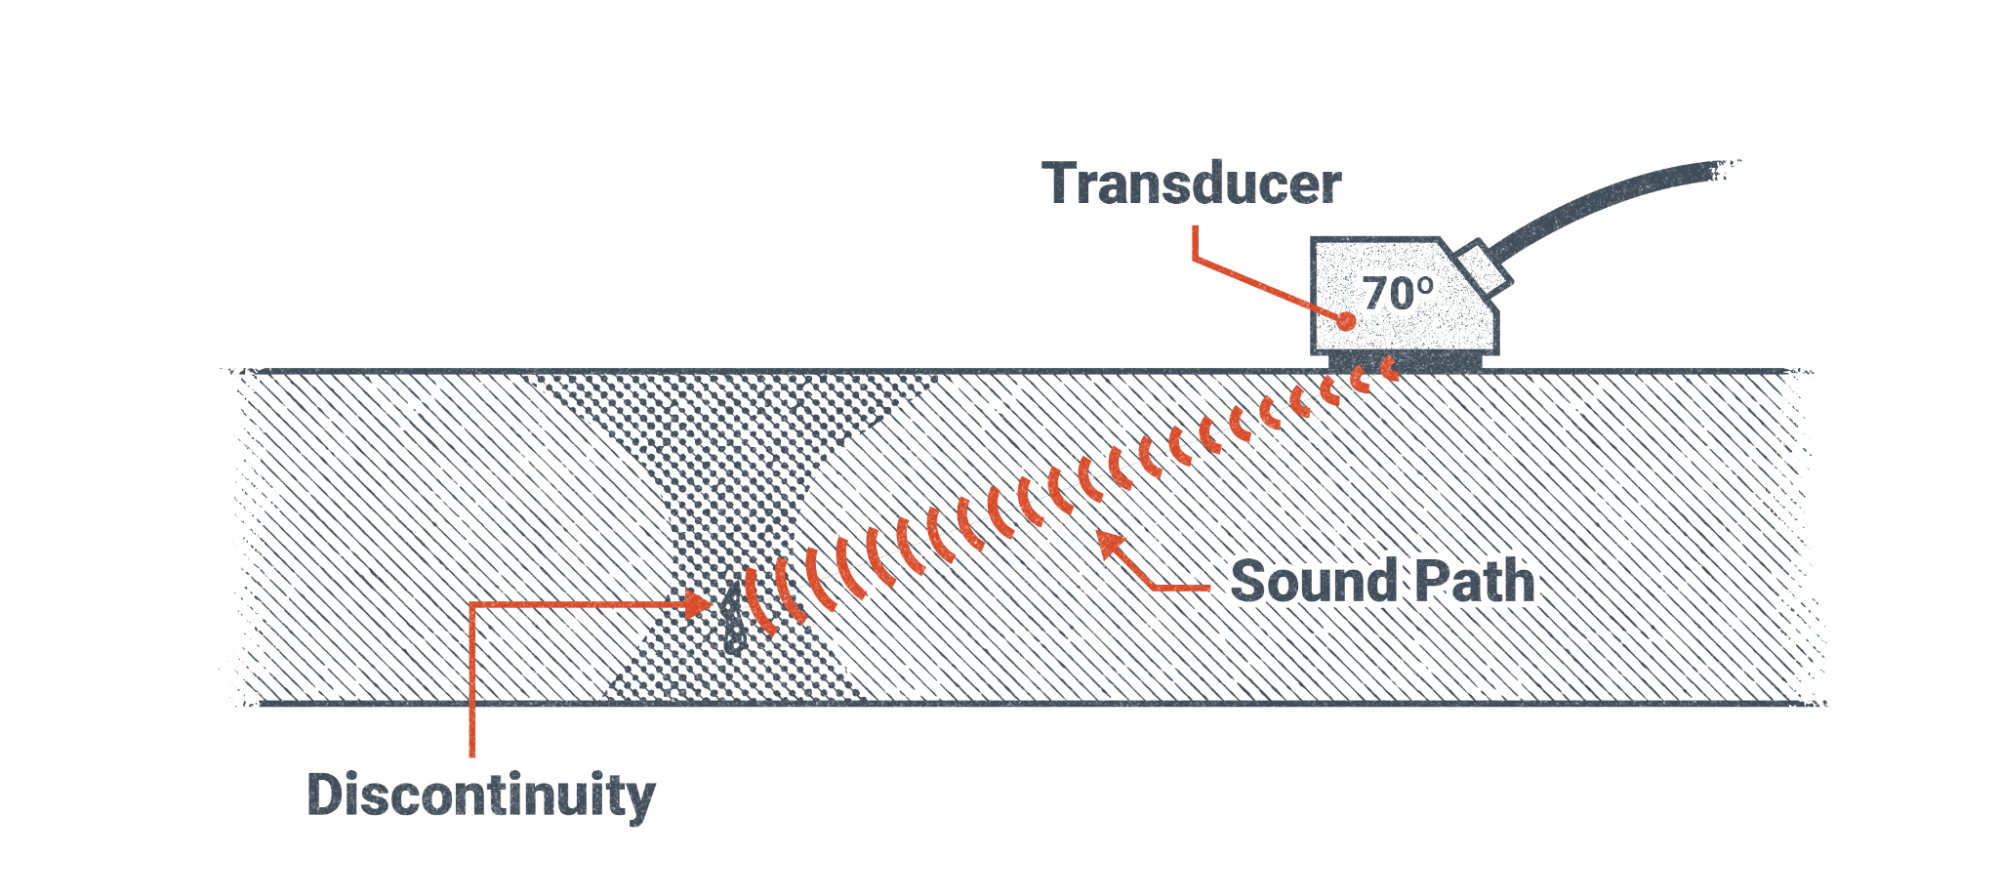
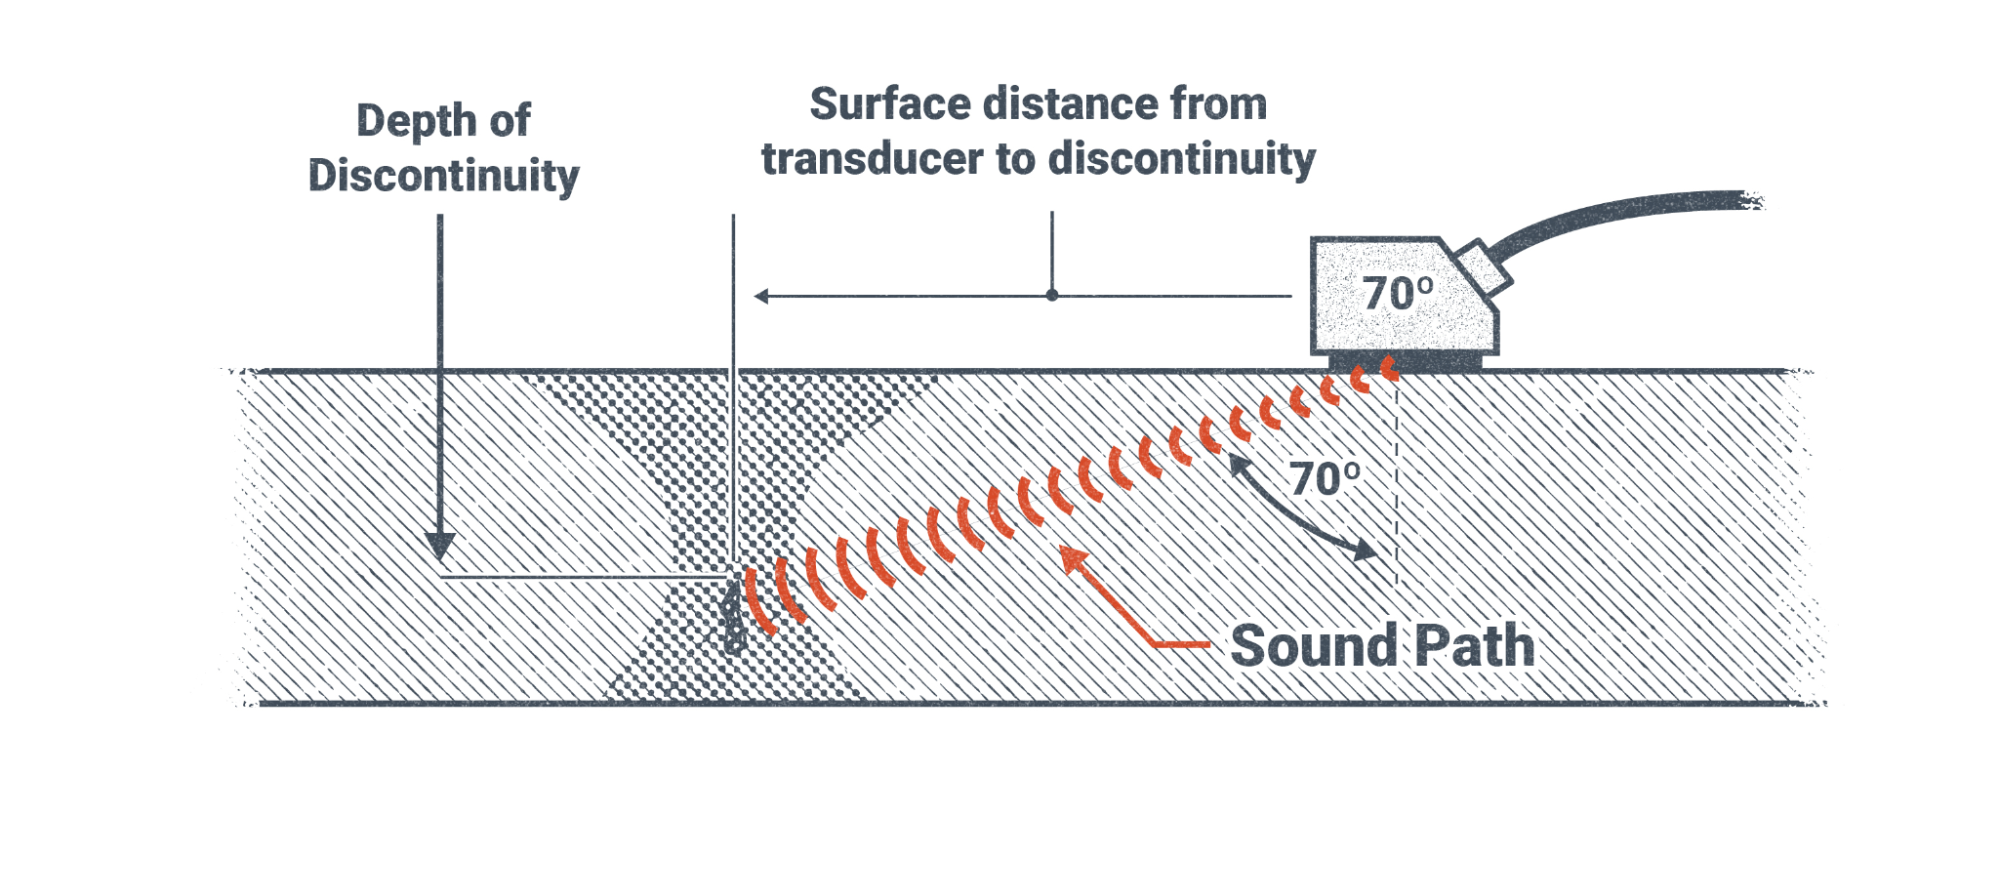
The distance between the weldment and the transducer allows for the depth of the discontinuity to be calculated. The time it takes for the ultrasonic wave to return determines the distance, and the angle of the transducer allows for the depth to be calculated from the distance the sound traveled. The spikes seen in Figure 19.32 are interpreted by the trained technician. Some spikes are expected, such as the initial bang that represents sound bouncing back from the surface of the material directly next to the transducer and spikes from surface reflectivity. Spikes from discontinuities are what the inspector is looking out for.
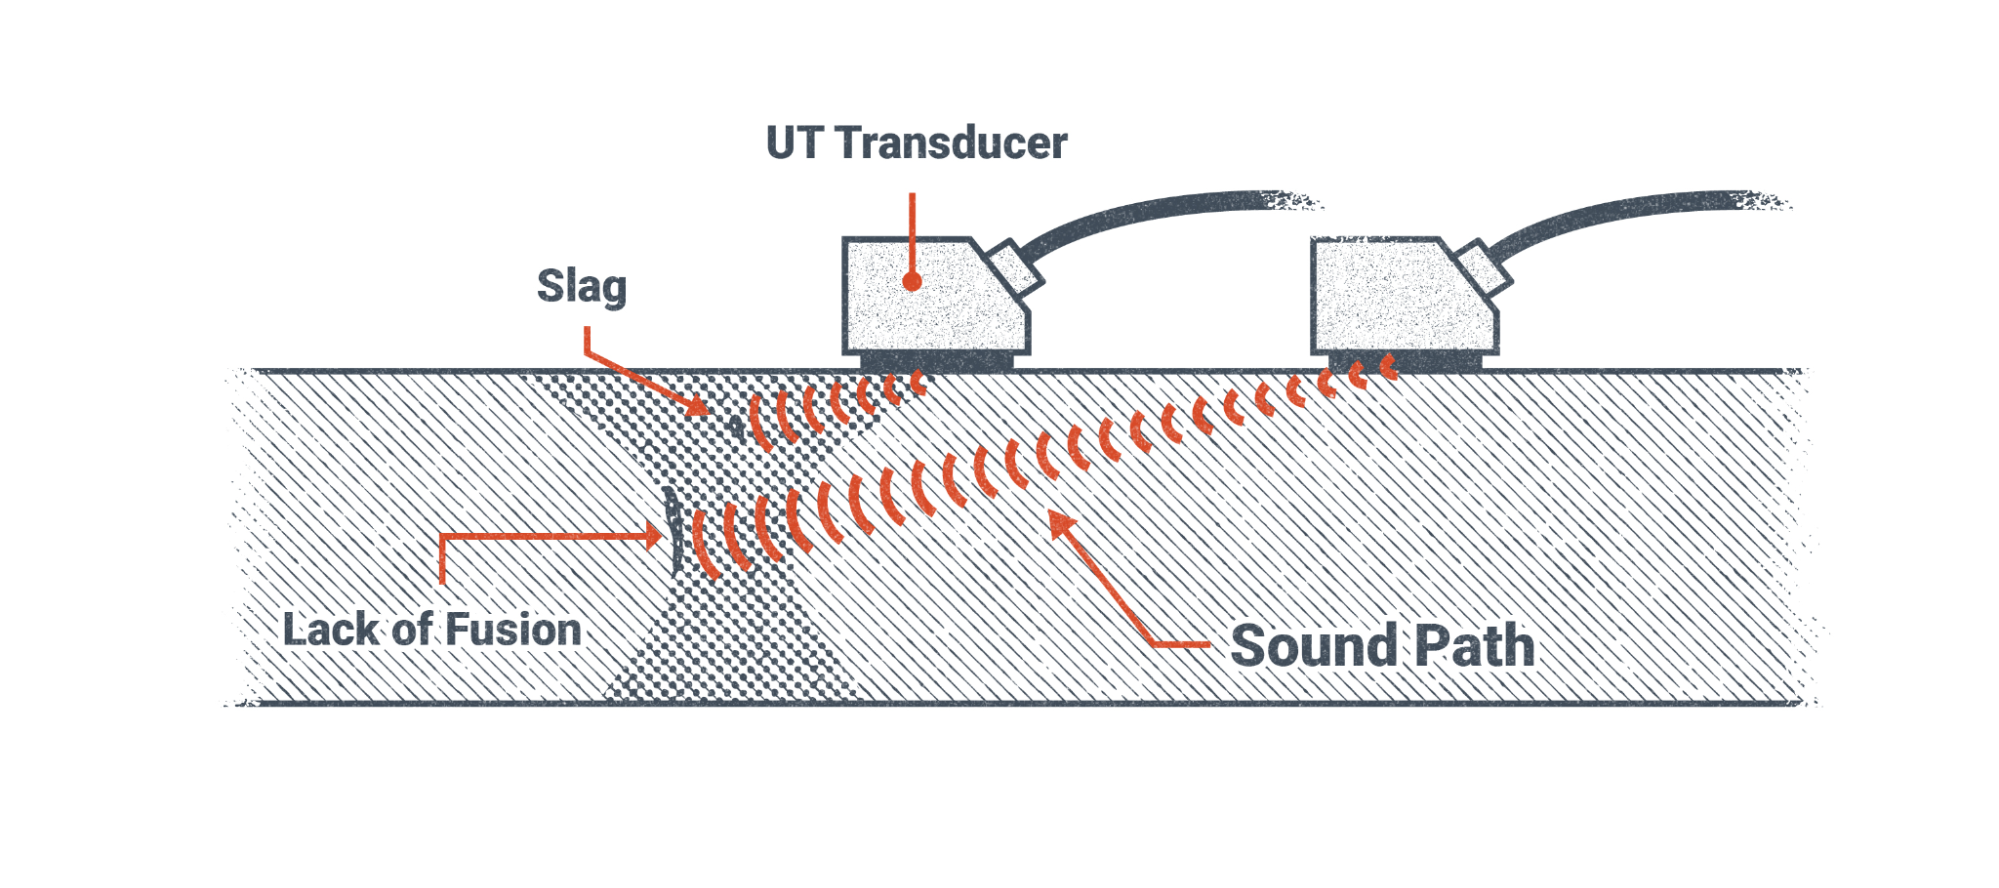
You can see two transducers in Figure 19.35,which shows how the position of the transducer will detect different discontinuities at different depths into the weldment. The closer the transducer is to the discontinuity, the shallower it is.
An improvement upon the single transducer previously discussed is a process called phased array UT (PAUT). With a phased array, multiple transducers within a single element transmit ultrasonic sound waves into the weldment being examined (see Figure 19.36). This allows for a more complete picture to be formed on the screen.
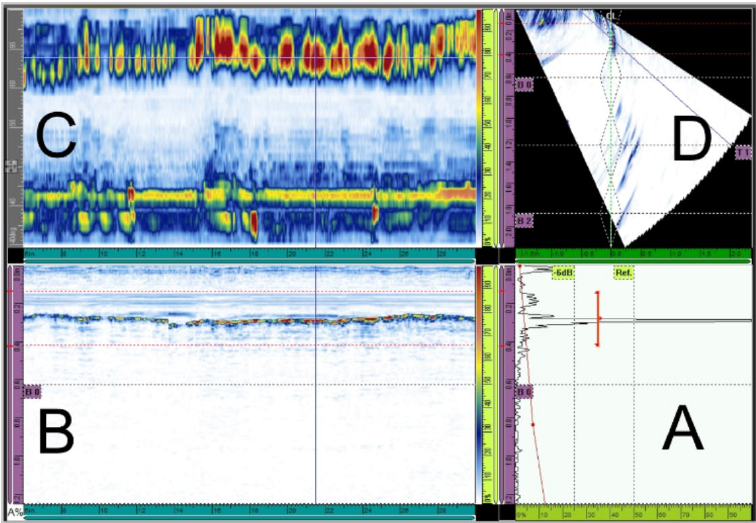
The image shown in section D of Figure 19.38 depicts discontinuities encountered in a weldment being inspected. Again, these images are interpreted by a trained inspector and not by welders. That being said, it is still important for the welder to be familiar with the inspection techniques used so they can properly prepare the weldment prior to the inspection.
Attributions
- Figure 19.1: Overlap in a fillet weld by United States Department of Transportation, Federal Highway Administration in the Public Domain; United States government work
- Figure 19.2: Example of porosity by United States Department of Transportation, Federal Highway Administration in the Public Domain; United States government work
- Figure 19.3: Example of slag trapped in a CJP weld by United States Department of Transportation, Federal Highway Administration in the Public Domain; United States government work
- Figure 19.4: Metal Weld Cracks by Nicholas Malara, for WA Open ProfTech, © SBCTC, CC BY 4.0
- Figure 19.5: Example of crack in underfilled weld crater by United States Department of Transportation, Federal Highway Administration in the Public Domain; United States government work
- Figure 19.6: Example of weld spatter by United States Department of Transportation, Federal Highway Administration in the Public Domain; United States government work
- Figure 19.7: Examples of Arc Strikes by United States Department of Transportation, Federal Highway Administration in the Public Domain; United States government work
- Figure 19.8: Applying Dye Penetrant to Surface by United States Department of Transportation, Federal Highway Administration in the Public Domain; United States government work
- Figure 19.9: Cleaning Surface to Remove Dye by United States Department of Transportation, Federal Highway Administration in the Public Domain; United States government work
- Figure 19.10: Applying Developer to Provide Contrast with Dye Emerging from a Crack by United States Department of Transportation, Federal Highway Administration in the Public Domain; United States government work
- Figure 19.11: Crack Indication Formed by Dye Emerging from Crack by United States Department of Transportation, Federal Highway Administration in the Public Domain; United States government work
- Figure 19.12: Peening evidence on Specimen 1U3 by United States Department of Transportation, Federal Highway Administration in the Public Domain; United States government work
- Figure 19.13: Part Inspection/Evaluation by U.S. Department of Energy, Office of Energy, Efficiency and Renewable Energy, National Renewable Energy Laboratory in the Public Domain; United States government work
- Figure 19.14: Test Pressure by U.S. Department of Transportation in the Public Domain; United States government work
- Figure 19.15: Magnetic Testing Prods (L) Yoke (R) by Nicholas Malara, for WA Open ProfTech, © SBCTC, CC BY 4.0
- Figure 19.16: Magnetic Testing Particle Accumulation by Nicholas Malara, for WA Open ProfTech, © SBCTC, CC BY 4.0
- Figure 19.17: Magnetic Testing by United States Department of Transportation, Federal Highway Administration in the Public Domain; United States government work
- Figure 19.18: Eddy Current Testing by Nicholas Malara, for WA Open ProfTech, © SBCTC, CC BY 4.0
- Figure 19.19: Eddy Currents and Flows by Nicholas Malara, for WA Open ProfTech, © SBCTC, CC BY 4.0
- Figure 19.20: Crack Location in a Rail by Nicholas Malara, for WA Open ProfTech, © SBCTC, CC BY 4.0
- Figure 19.21: Magnetic Testing by United States Department of Transportation, Federal Highway Administration in the Public Domain; United States government work
- Figure 19.22: Left: Eddy Current Equipment used in the Project. This is one of several systems that are commercially available for eddy current inspection of thread regions. The authors, the RSPA and the DOT do not endorse any specific system manufacturer. Right: Closeup of an Eddy Current Probe Threaded onto the Calibration Block by Research and Special Programs Administration and the Department of Transportation in the Public Domain; United States government work
- Figure 19.23: An eddy current probe fixture is used to evaluate a thruster center body diffuser nozzle. by NASA White Sands Test Facility in the Public Domain; United States government work
- Figure 19.24: Radiation in Healthcare: X-Rays by U.S. Department of Health and Human Seervices, Centers for Disease Control and Prevention in the Public Domain; United States government work
- Figure 19.25: Radiographic Testing by Nicholas Malara, for WA Open ProfTech, © SBCTC, CC BY 4.0
- Figure 19.26: X-ray generator shipping box by Idaho National Laboratory in the Public Domain; United States government work
- Figure 19.27: Installing solid plug by Idaho National Laboratory in the Public Domain; United States government work
- Figure 19.28: Radiography in a bridge shop by U.S. Department of Transportation, Federal Highway Administration in the Public Domain; United States government work
- Figure 19.29: Radiography in a bridge shop by U.S. Department of Transportation, Federal Highway Administration in the Public Domain; United States government work
- Figure 19.30: Radiographic Testing by Nicholas Malara, for WA Open ProfTech, © SBCTC, CC BY 4.0
- Figure 19.31: Illustration of notional radiographic inspection of metal weld cracks by NASA in the Public Domain; United States government work
- Figure 19.32: Ultrasonic Testing Butt Joint Schematic by Nicholas Malara, for WA Open ProfTech, © SBCTC, CC BY 4.0
- Figure 19.33: Ultrasonic Testing with a 70° Transducer by Nicholas Malara, for WA Open ProfTech, © SBCTC, CC BY 4.0
- Figure 19.34: Ultrasonic Testing Discontinuity Distance by Nicholas Malara, for WA Open ProfTech, © SBCTC, CC BY 4.0
- Figure 19.35: Ultrasonic Testing by Nicholas Malara, for WA Open ProfTech, © SBCTC, CC BY 4.0
- Figure 19.36: Phased Array Ultrasonic Testing by Nicholas Malara, for WA Open ProfTech, © SBCTC, CC BY 4.0
- Figure 19.37: Use of PAUT for an unusual CJP bridge weld by U.S. Department of Transportation, Federal Highway Administration in the Public Domain; United States government work
- Figure 19.38: PAUT examination output by U.S. Department of Transportation, Federal Highway Administration in the Public Domain; United States government work
Nondestructive examination describes a set of examination techniques that do not destroy the fabrication being inspected. The basic premise of a non-destructive test is to provide the inspector with information about the quality of the weldment without damaging or altering the weldment.
A change in the base material that makes the base material non continuous in its nature.
Overlap occurs when the molten weld pool does not fuse into the base material. The weld pool falls on top of the base material and is not solidly connected to it.
Porosity occurs when gasses produced during welding can not escape the molten weld pool before it solidifies.
The change in metals that occurs when a force is applied to them beyond their ability to return back to their original shape. The material acts like a plastic or taffy and it stretches.
Slag inclusions are weld defects that occur when the weld pool passes over bits of preformed slag and doesn’t remelt them. This causes the slag to be trapped between layers of weld metal.
Slag is a byproduct of flux as it breaks down in the arc. Slag is used to cover the molten weld pool to protect it from the atmosphere, help it hold its shape, and slow the cooling process to prevent cracking.
A long, typically thin defect, that is much much longer than it is wide. Cracks propogate to become longer.
Cracks that occur perpendicular to the direction of travel of the weld bead
Cracks that occur parallel to the direction of travel of the weld bead
Cracks that usually occur in a depression or crater at the end of a weld bead and radiate from the center of the crater out
Spatter is a weld defect that occurs during welding when small globules of molten metal land outside the weld pool and stick to the base metal surface.
An electronic piece of equipment that both emits and detects sound waves. It converts an electrical signal to a sound wave when transmitting and converts sound to an electrical signal when detecting sound waves.
The creation of arcs with a welding electrode. Arc strikes typically mean arcs with the base material in an unintended location outside of the of the weld joint. Arc strikes are typically short and thin almost like striking a match.
A weldment is anything composed primarily of metal and is held together by welding.
Capillary action is when liquid flows into narrow or small spaces with no force acting against it.
With electricity, current is the measure of electrons moving though a conductor over a given period of time, typically per second. Measured in Amperes or Amps for short.
Alternating current (AC) is an electric current that is constantly changing polarity, from direct current electrode positive to direct current electrode negative, many times per second. In North America this change happens at 60 Hertz, or 60 cycles per second.
a number with a real and imaginary part. These numbers are used in processing Ultrasound images. The actual processing of the images is beyond the scope of this book but it is worth pointing them out since they appear in the display screen of the UT equipment.
Capacitance is the resistance to a change in voltage while inductance is the resistance to a change in current.
Inductance is a setting on your welding machine to control spatter when welding GMAW in the short circuit transfer mode.
