1 Introduction to Geographic Science
Cameron McCormick
Learning Outcomes
- Recognize the history and evolution of the geographic profession.
- Explain the science of geography today.
- Summarize the basic components of spatial thinking
- Explain the overarching concept of geospatial technology and the technologies it includes.
INTRODUCTION
Geography is the scientific study of the earth and is one of the original disciplines along with philosophy in trying to understand the world humans live in. The geographic discipline has two sub-categories, physical geography and cultural geography, which allows geographers the scientific credibility to look at cultural issues of economics, demographics, culture, language, religion, or urban planning. It also allows geographers to focus on climate, climate change, biogeography, geomorphology, or environmental issues of pollution, desertification, deforestation, or species extinction. This unique ability also allows geographic scientists to study how the cultural environment influences the physical environment and vice versa. Geography is a physical science and social science, but also has the academic credibility to study the interaction between the two.
What makes the scientific discipline of geography different from other science disciplines is its emphasis on space, place, and connection. The overarching question that geographers ask is “Where?”. The technology geographers and other scientists use to study the physical and cultural environments spatially and over time is geospatial technology. Geospatial technology is an umbrella term that encompasses global positioning systems (GPS), remote sensing (i.e. satellite imagery and aerial photography), and geographic information systems (GIS).
HISTORY OF THE GEOGRAPHIC DISCIPLINE
Geography is often times called the “mother of all sciences” because geography is one of the earliest known scientific disciplines that date back to the original Homo-sapiens who migrated out of eastern Africa, into Europe, Asia, and beyond. In fact, some would argue that spatial awareness and early mapping were more significant to the development and migration of humans out of Africa than language. There is no single, linear or historic pathway through the cultural development of geography because the discipline is inherently human. Humans have always had a need and desire to explore their surroundings, expand their influence and sometimes dominance over new lands.
Modern geography probably originated in Western Europe during the 16th century as the region experienced economic and social growth, as well as upheaval brought about by new navigational methods and colonization. Geography, as a formal discipline, came about as sailing and trade routes across the great oceans become more common. This required new knowledge in navigation, mathematics, literacy, science, medicine, warfare, and of course, cartography (map making). A cartographer is someone who is skilled in the science and art of map-making. Some scholars who research concepts of critical cartography have posited that modern mapping is grounded in power, dominance, control, war, racism, and the dismantling of foreign cultures. Thus, maps in the past, present, and future will play a powerful role in how we understand the world because maps help shape our sense of place, and those who create the maps often shape our historical, cultural, and political interactions with place.
Alexander von Humboldt and Carl Ritter, according to many in the field, took geography from a primarily navigation-oriented discipline to more scholarly pursuits. Both scholars wanted to understand the natural and human environments from a systematic and objective perspective as a way to explain specific regions of the world. Over time, academic and institutionalized organizations of geographic research grew throughout Europe. The need for skilled geographers and cartographers grew ever more important to countries because they provided the powerful and elite detailed surveys and spatial information about the physical and cultural environments they wanted to explore and exploit. This was especially true as colonial powers desired the resources (natural and human), and the prestige of controlling Africa in the 1800s.
Geography transformed from a discipline centered on navigation to a pathway for imperial exploration, and then to a discipline of imperial science. Sadly, many geographers took Charles Darwin’s ideas of evolution and natural selection and applied them to a perverted interpretation called Social Darwinism. This idea, first constructed by economists in Europe, implies that natural selection could easily be applied to social and political concepts. It was Social Darwinists that coined the term “survival of the fittest,” not Charles Darwin. Under this hypothesis, natural selection could be used to justify the need for “stronger” nation-states or races to dominate over “weaker” nation-states and races.
Social Darwinism later grew into scientific racism. This became a systematic problem throughout the discipline of geography because it justified European explorers and settlers’ ideas that they were genetically superior to other races, as well as entitled and destined to expand their civilizations and belief systems as they had been doing for over 400 years. This included European settlers in the Americas or “New World.”
World Wars I and II caused a major shift in geographic thought. By this time, most of the world had been navigated, explored, and in essence, colonized. Any new expansion would likely require colonial powers to conquer each other. Many geographers played a leading role in advising national leaders on Post-war Reconstruction and a new era of geography was born. Geographers understood the need to merge scientific thoughts in physical and cultural geography when trying to understand a region of the world and to value diversity and uniqueness within these regions grounded within spatial science.
Geographic Science Today
As stated earlier, geographers study both the physical, environmental, and cultural aspects of the world. Besides being called the “mother science,” some say that geographers “are a mile wide and an inch deep” because geographers have to know a lot about the physical, environmental, or cultural world, but may not go into the depth that other disciplines might. Since so many disciplines have branched off from geography, the discipline of geography has had to find its own focus, emphasis, and depth.
Physical geography focuses on natural origins and processes of the physical earth. Some physical geographers focus on environmental issues and are called environmental geographers, a sub-discipline of physical geography. Physical geographers focus on weather, climate and climate change, landforms, environmental pollution, river processes, and more. Cultural geographers emphasize human endeavors such as population, language, religion, culture and ethnicity, economics and development, geopolitics, urban planning, and more. Geographers in this line of science are often called human geographers.
Ultimately, the entire geography profession is focused on the spatial distribution or arrangement of the physical and cultural world. One of the discipline’s greatest strengths and contributions to science and society is their study of interrelationships between physical and cultural elements of the earth’s environment. Maybe it’s the interrelationship between river systems and soil, or climate and ecosystems, or even the connections between deforestation, species extinction, population growth, and poverty issues. The interconnectedness of all areas of geography often requires many geographers to train in both physical and cultural geography. In fact, probably the greatest strength of the science of geography is the discipline’s ability to study the world spatially and look for the interconnections between the physical and cultural environments.
THE SCIENTIFIC PROCESS OF GEOGRAPHY
Geography is a science and thus uses the scientific method for data collection, analysis, and interpretation. The scientific method varies slightly between scientific disciplines. There are various methods to acquire scientific knowledge from the physical sciences, biological sciences, social sciences, and everything in between. A simplified version of what most scientific disciplines follow are:
- Observe a particular feature, phenomenon, or event in the world that stimulates a series of questions and thought process.
- Develop an educated thought that tries to answer the questions posed, called a hypothesis.
- Design an experiment or way to “test” your hypothesis.
- Implement the experiment and observe the results using unbiased data and measurement techniques.
- Propose a solution, answer, or rule that explains the hypothesis and experiment.
Science is about probability and not absolutes. Scientists will regularly publish the results of their research in a scientific journal so that others can attempt to reproduce the same results. Sharing knowledge is a key component of science, and really for all of humanity. A hypothesis is an “educated idea” that tries to explain a particular aspect, feature, or event. In everyday conversations, a “theory” is a hunch or guess about something. In the scientific community, a theory represents the highest order of understanding for a body of information. When scientists talk about the theories of plate tectonics, evolution, climate change, or the Big Bang, it is not an idea or hunch scientists have about something. Climate scientists have a high probability that the recent warming of the planet has been caused by natural cycles and variations and human impacts like burning fossil fuels. But notice that scientists do not and cannot offer absolutes percentages or statements. Rather, they will point to what the “evidence suggests.” What this means is that our understanding of climate change can and will change as more data collection and evidence comes to light. This applies to other important scientific theories such as evolution, the big bang, plate tectonics, and others.
Scientific and Geographic Inquiry

SCIENTIFIC INQUIRY
Science is a path to gaining knowledge about the natural world. The study of science also includes the body of knowledge that has been collected through scientific inquiry. To conduct a scientific investigation, scientists ask testable questions that can be systematically observed and careful evidenced collected. Then they use logical reasoning and some imagination to develop a testable idea, called a hypotheses, along with explanations to explain the idea. Finally, scientists design and conduct experiments based on their hypotheses.
Scientists seek to understand the natural world by asking questions and then trying to answer the questions with evidence and logic. A scientific question must be testable and supported by empirical data, it does not rely on faith or opinion. Our understanding of natural Earth processes help us to understand why earthquakes occur where they do and how to understand the consequences of adding excess greenhouse gases into the atmosphere. Scientific research may be done to build knowledge or to solve problems and lead to scientific discoveries and technological advances. Pure (or abstract) research often aids in the development of applied research. Sometimes the results of pure research may be applied long after the pure research was completed. Sometimes something unexpected is discovered while scientists are conducting their research. Some ideas are not testable. For example, supernatural phenomena, such as stories of ghosts, werewolves, or vampires, cannot be tested.
Scientists describe what they see, whether in nature or in a laboratory. Science is the realm of facts and observations, not moral judgments. Scientists might enjoy studying tornadoes, but their opinion that tornadoes are exciting is not important to learning about them. Scientists increase our technological knowledge, but science does not determine how or if we use that knowledge. Scientists learned to build an atomic bomb, but scientists didn’t decide whether or when to use it. Scientists have accumulated data on warming temperatures; their models have shown the likely causes of this warming. But although scientists are largely in agreement on the causes of global warming, they can’t force politicians or individuals to pass laws or change behaviors.
For science to work, scientists must make some assumptions. The rules of nature, whether simple or complex, are the same everywhere in the universe. Natural events, structures, and landforms have natural causes and evidence from the natural world can be used to learn about those causes. The objects and events in nature can be understood through careful, systematic study. Scientific ideas can change if we gather new data or learn more. An idea, even one that is accepted today, may need to be changed slightly or be entirely replaced if new evidence is found that contradicts it. Scientific knowledge can withstand the test of time because accepted ideas in science become more reliable as they survive more tests.
GEOGRAPHIC INQUIRY
Geography is the study of the physical and cultural environments of the earth. What makes geography different from other disciplines is its focus on spatial inquiry and analysis. Geographers also try to look for connections between things such as patterns, movement and migration, trends, and so forth. This process is called geographic or spatial inquiry. In order to do this, geographers go through a geographic methodology that is quite similar to the scientific method, but again with a geographic or spatial emphasis. This method can be simplified in a five step geographic inquiry process.
- Ask a geographic question. Ask questions about spatial relationships in the world around you. At its most basic, ask “Where?”
- Acquire geographic data. Identify data and information that you need to answer your question. Geographic data is data that includes and is applied to a location or a region.
- Explore geographic data. Turn the data into maps, tables, and graphs, and look for patterns and relationships.
- Analyze geographic information. Determine what the patterns and relationships mean with respect to your question.
- Act upon geographic information. Use and apply the knowledge.
“Knowing where something is, how its location influences its characteristics, and how its location influences relationships with other phenomena are the foundation of geographic thinking. This mode of investigation asks you to see the world and all that is in it in spatial terms. Like other research methods, it also asks you to explore, analyze, and act upon the things you find. It also is important to recognize that this is the same method used by professionals around the world working to address social, economic, political, environmental, and a range of scientific issues.” (ESRI)
When geographers use the term ‘spatial’ they mean the three dimensional aspects of earth; length, width, and height; not the extraterrestrial use of the term. All three of those terms, length width and height, are measured as a distance. Height is distance above or below a surface. Length and width are distances from a starting point but measured 90° in different directions. In this paragraph I’ve used key geographic concepts of ‘distance’ and ‘direction’. Those concepts are critical in describing a location. Many geographic questions have some form of “how far” or “which direction” embedded in the question.
SPATIAL THINKING AND ANALYSIS
Geoliteracy
Above all else, geography is considered a spatial science. It is concerned with the spatial behavior of people, with the spatial relationships that are observed between places on the earth’s surface, and with the spatial processes that create or maintain those behaviors and relationships. Geographers are concerned the intersections between space (aerial extent) and place. A geoliterate person is able to reason and make decisions by understanding the interactions (systems thinking), interconnections (how are places connected), and implications (reason out impacts of actions). If you are not yet able to think like that, you will be at a disadvantage to someone who can think that way.
Video: definition and importance of geoliteracy
video link: https://education.nationalgeographic.org/resource/what-is-geo-literacy/
Imagine a company’s purchasing agent placing an order for snow blowers based only on past sales, not knowing that the customers in the area have changed or not knowing if it’s an El Nino or La Nina year.
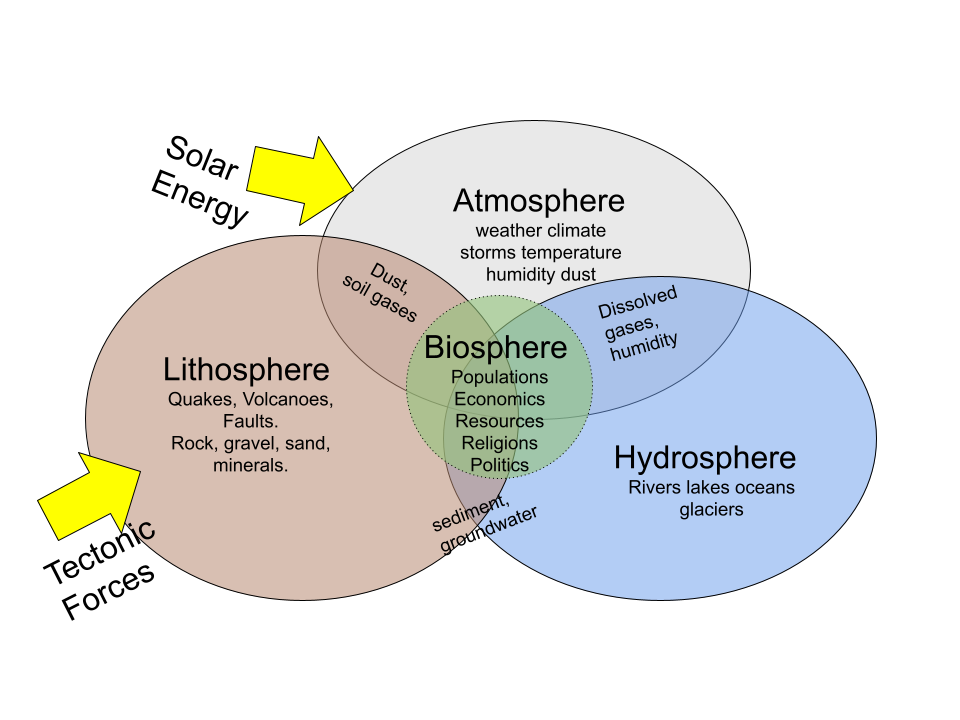
Systems Thinking
A system is a set of connected components which work together and create an output when energy is added. The components are a series of storages and flows between them.
Sometimes the output is harmful to the production of the system, called a negative result. A different stimulus, or the same stimulus at different point in the system or different time, may increase or improve the system production, which would be a positive result. The positive result may be good for the system, but bad for humans and a negative result can be bad for the system but good for humans.
There are two major subsystems on earth and this course will look at components of both. Many people people investigate deeply into small parts of these systems, but a good geographer steps back frequently to see how the parts are connected to the whole system. The Human Subsystem is composed of the beliefs, institutions, and technologies of humans.
Place is a particular area or point on Earth that has a particular characteristic. Every place on earth has a unique location physically and conceptually. A region is an area on the earth’s surface that has distinctive physical and cultural characteristics.
A very important concept in geography is scale, which is the relationship between the locations of something on the earth compared to the entire earth. Scale can range from the atomic level to the entire planet or even space.
Connection is the relationship between the physical or cultural components of the world, (or both), that crosses barriers and boundaries.
Location
Location is probably one of the most significant aspects of the discipline, which is a position of an object that could be put on a map. That location doesn’t need to be on the Earth’s surface, it can be below, within the oceans, the atmosphere, or even in space. Location can also be divided into nominal, relative, and absolute. Nominal locations are the names of a place. Examples include Washington D.C., the Rocky Mountains, the Nile River, or Florida. Nominal locations just specify a location’s name and their scale can vary.
Relative location is a very common form of location. How often have you given directions to your house using landmarks rather than just your address? Relative location is the location of something relative to other features. You can understand a lot about a place based on what’s around it.
The third kind of location is called absolute location, which is the particular location of something. This is usually based on some sort of geographic coordinate system like latitude and longitude. If you think about it, many navigation GPS systems use relative and absolute locations. If you were to type in an address and used your current location as the starting point into a mapping system like Google Maps, it will not only give you the location of your destination, it will also give you a few relative pathways to get there.
Direction
Next in our study of spatial thinking is direction and distance. Direction is the location of something relative to something else. If we refer back to our example with Google Maps, an online program will determine a direction based on your current location and your intended destination. Relative direction can change depending on your point of view. If you are facing someone and discuss a tree to your right, that same tree is to the left of another person. However, absolute directions won’t change. If that same tree is to the north of you, it is also to the north of the other person. Some people have a preference for using directions that are either absolute or relative, and that preference may change depending on the situation. It could be better to give absolute directions to your house if people will be coming from different locations since some would turn left and other would turn right at the same intersection.
Distance
Distance is a mathematical concept and used to determine the space between two or more features using some form of measuring unit. A simple example of this would be using Google Maps to determine the distance from Salt Lake City, Utah to Portland, Oregon shown above, which is about 766 miles per hour. Distances using an agreed upon unit of measurement such as a mile or a kilometer are unchanging, they are absolute distances. But the time needed to travel that distance may change depending on whether you drive, fly or walk. Time is an example of relative distance. Delivery companies are interested in both types of distance because vehicles wear out based on absolute distance, but a customer requires an on-time delivery which is a form of relative distance.
Location, direction, and distance are central concepts in geography. You can not determine location without both distance and direction. (“Meet me northwest of here.”)
Space
Geographers are also concerned with issues of space. In particular, they are concerned with what exists between spaces. Are the features between the spaces related or similar to each other or dissimilar? The 1st Law of Geography states that points near each other are more likely to be related than points farther apart, but that isn’t always the case. Networks are concerned with the movement or flow of an object through space and time. This can apply to transportation, migration, trade, flow of rivers, glacier, or the atmosphere, and also the flow of cyber networks.
Networks are in fact a type of system and geographers often deal with systems analysis. In describing a system the geographer explains where something is coming from, where it is going, the rates and methods of movement. A systems analysis of global warming will investigate the sites where large volumes of carbon are stored such as the atmosphere or fossil fuels and how carbon moves among those sites such as burning the fuels or plants incorporating atmospheric carbon in their tissue. Once the processes of movement and the locations of storage are understood, the big question becomes “how do these changes affect humans who live in different locations?”.
A geographic explanation can either describe the characteristic of a single site, or it’s situation relative to other sites. The concepts of location, distance, direction are all included in spatial analysis. Descriptions of density, concentration, and pattern across the landscape are useful to understand what makes spaces unique.
Big Data
Data is everywhere, especial big data and spatial data. Big data refers to the fact that their is so much data that we can now not only understand the physical and cultural world, but we can start to predict behavior. Big data can determine who your friends are, what your buying habits are and what you are willing to impulse buy. It allows businesses to determine what your purchasing power is and what draws you. Scientists use it to understand complex systems such as ecological processes, weather patterns, and climate change.
Spatial data is now a form of big data. It’s collected every time you go to the grocery store and use their card to reduce the costs, when you click on a link on Facebook, or when you do any kind of search on a search engine like Google, Bing, or Yahoo!. It is used by your state department of transportation when you are driving on a freeway or when you use an app on a smart phone. Futurists believe that in the near future, face recognition technology will allow a sales representative know what types of clothes you like to buy based on a database of your recent purchases at their store and others.
Now there are two basic types of data you need to know: spatial and non-spatial data. Spatial data, also called geospatial data, is data that can be linked to a specific location on Earth. Geospatial data is becoming “big business” because it isn’t just data, but data that can be located, tracked, patterned, and modeled based on other geospatial data. Census information that is collected every 10 years is an example of spatial data. The geospatial data industry was already valued at over $400B USD in 2016 by AlphaBeta.
Non-spatial data is data that cannot be specifically traced to a specific location. This might include the number of people living in a household, enrollment within a specific course, or gender information. But non-spatial data can easily become spatial data if it can be linked in some way to a location. Geospatial technology specialists have a method called geocoding that can be used to give non-spatial data a geographic location. Once data has a spatial component associated with it, the type of questions that can be asked dramatically changes.
Here are some ways good quality geospatial data helps society:
Geospatial Technology

Remote Sensing
Remote sensing can be defined as human’s ability to study objects without being in direct physical contact with them. So for example, your eyes are a form of passive remote sensing because they are “passively” absorbing electromagnetic energy within the visible spectrum from distant objects and your brain is processing that energy into information. There are a variety of remote sensing platforms or devices, but they can basically be categorized into the following that we will look at throughout the course.
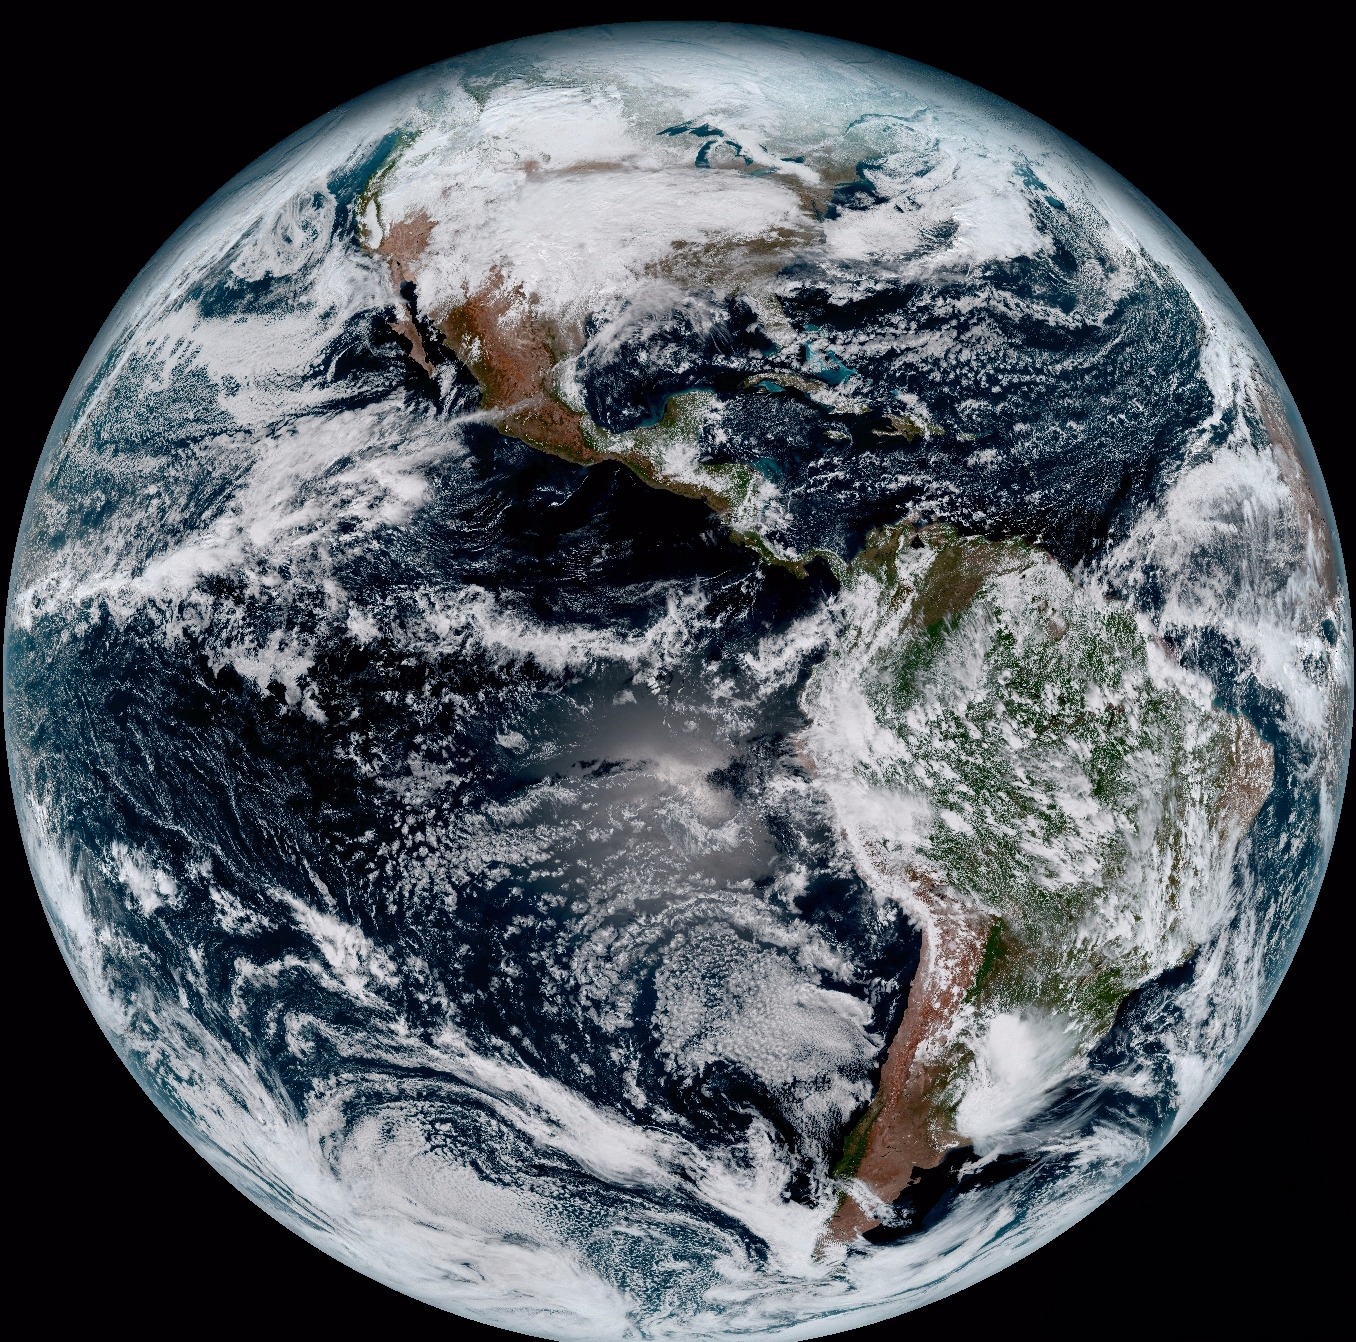
Nasa: Earth from Orbit
Satellite imagery is a type of remotely sensed imagery taken of the Earth’s surface, which is produced from orbiting satellites that gather data via electromagnetic energy. Next is areal photography, which is film-based or digital photographs of the Earth, usually from an airplane or non-piloted drone. Images are either taken from a vertical or oblique position. Third is radar, which is an interesting form of remote sensing technology that uses microwave pulses to create imagery of features on Earth. This can be from a satellite image or ground-based Doppler radar for weather forecasting. Finally, a fast growing realm of remote sensing is called Light Detection and Ranging or Lidar, which is a form of remote sensing that measures distance of objects using laser pulses of light.

Global Positioning Systems
Another type of geospatial technology is global positioning systems (GPS) and a key technology for acquiring accurate control points on Earth’s surface. Now to determine the location of that GPS receiver on Earth’s surface, a minimum of four satellites are required using a mathematical process called triangulation. Normally the process of triangulation requires a minimum of three transmitters, but because the energy sent from the satellite is traveling at the speed of light, minor errors in calculation could result in large location errors on the ground. Thus, a minimum of four satellites is often used to reduce this error. This process using the geometry of triangles to determine location is used not only in GPS, but a variety of other location needs like finding the epicenter of earthquakes.
A user can use a GPS receiver to determine their location on Earth through a dynamic conversation with satellites in space. Each satellite transmits orbital information called the ephemeris using a highly accurate atomic clock along with its orbital position called the almanac. The receiver will use this information to determine its distance from a single satellite using the equation D = rt, where D = distance, r = rate or the speed of light (299,792,458 meters per second), and t = time using the atomic clock. The atomic clock is required because the receiver is trying to calculate distance, using energy that is transmitted at the speed of light. Time will be fractions of a second and requires a “time clock” up the utmost accuracy.
Geographic Information Systems

A geographic information system (GIS) is a technology that brings together remote sensing data, GPS data points, spatial and non-spatial data, and spatial statistics into a single, dynamic system for analysis. A GIS is a powerful database system that allows users to acquire, organize, store, and most importantly analyze information about the physical and cultural environments. A GIS views the world as overlaying physical or cultural layers, each with quantifiable data that can be analyzed. A single GIS map of a national forest could have layers such as elevation, deciduous trees, evergreens, soil type, soil erosion rates, rivers and tributaries, major and minor roads, forest health, burn areas, regrowth, restoration, animal species type, trails, and more. Each of these layers would contain a database of information specific to that layer.
Nearly every discipline, career path, or academic pursuit uses geographic information systems because of the vast amount of data and information about the physical and cultural world. Disciplines and career paths that use GIS include: conservation, ecology, disaster response and mitigation, business, marketing, engineering, sociology, demography, astronomy, transportation, health, criminal justice and law enforcement, travel and tourism, news media, and the list could endlessly go on.
Now, GIS primarily works from two different spatial models: raster and vector. Raster based GIS models are images much like a digital picture. Each image is broken down into a series of columns and rows of pixels and each pixel is georeferenced to somewhere on Earth’s surface is represents a specific numeric value – usually a specific color or wavelength within the electromagnetic spectrum. Most remote sensing images come into a GIS as a raster layer. The other type of GIS model is called a vector model. Vector based GIS models are based on the concept of points that are again georeferenced (i.e. given an x-, y-, and possibly z- location) to somewhere specific on the ground. From points, lines can be created by connecting a series of points and areas can be created by closing loops of vector lines. For each of these vector layers, a database of information can be attributed to it. So for example, a vector line of rivers could have a database associated with it such as length, width, stream flow, government agencies responsible for it, and anything else the GIS user wants tied to it. What these vector models represent is also a matter of scale. For example, a city can be represented as a point or a polygon depending on how zoomed in you are to the location. A map of the world would show cities as points, whereas a map of a single county may show the city as a polygon with roads, populations, pipes, or grid systems within it.
Now more then ever society has access to spatial information through the use of geospatial technology, which is directly influencing how we understand the physical and cultural environments we live in. In 2013 the Washington Post had two articles on how maps help us understand our world titled 40 Maps That Explain Our World and 40 More Maps That Explain Our World. The images below are satellite images from NASA and proved by NASA’s Earth Observatory. Click on the thumbnails to see a large image and click on the those to get detailed information for each satellite image. All of the images in this eTextbook are free and licensed as Creative Commons. By clicking on any image, you will be directed to the original source.
 |
 |
Neil deGrasse Tyson: What’s Possible in 15 Years?
SCIENTIFIC METHOD
SCIENTIFIC QUESTIONING
The most important thing a scientist can do is to ask questions. Act like a 5 year old!
- What makes Mount St. Helens more explosive and dangerous than the volcano on Mauna Loa, Hawaii?
- What makes the San Andreas fault different than the Wasatch Fault?
- Why does Earth have so many varied life forms but other planets in the solar system do not?
- What impacts could a warmer planet have on weather and climate systems?
Many of these questions compare and explain the differences between two named locations. Sometimes only one location is described and it’s up to the reader to consider how the described characteristics differ compared to any other location of interest. For example a geographer could compare Seattle and Salt Lake City, or simply describe Seattle and let the reader compare Seattle with Salt Lake City, or Denver, or Spokane, or any city.
Earth science can answer testable questions about the natural world. What makes a question impossible to test? Some untestable questions are whether ghosts exist or whether there is life after death. A testable question might be about how to reduce soil erosion on a farm. A farmer has heard of a planting method called “no-till farming.” Using this process eliminates the need for plowing the land. The farmer’s question is: Will no-till farming reduce the erosion of the farmland?
|
Standard moldboard plow completely lifts and turns over the soil, burying plant material.
|
 Contour Plowing: Plow and plant across the slope, along constant elevation, to stop water and soil movement.
|
 No-till: Young green plants are growing in rows among previous stubble.
|

SCIENTIFIC RESEARCH
To answer a question, a scientist first finds out what is already known about the topic by reading books and magazines, searching the Internet, and talking to experts. This information will allow the scientist to create a good experimental design. If this question has already been answered, the research may be enough or it may lead to new questions. Example: The farmer researches no-till farming on the Internet, at the library, at the local farming supply store, and elsewhere. He learns about various farming methods. He learns what type of fertilizer is best to use and what the best crop spacing would be. From his research he learns that no-till farming can be a way to reduce carbon dioxide emissions into the atmosphere, which helps in the fight against global warming.
HYPOTHESIS
With the information collected from background research, the scientist creates a plausible explanation for the question. This is a hypothesis. The hypothesis must directly relate to the question and must be testable. Having a hypothesis guides a scientist in designing experiments and interpreting data. Example: The farmer’s hypothesis is this: No-till farming will decrease soil erosion on hills of similar steepness as compared to the traditional farming technique because there will be fewer disturbances to the soil.
DATA COLLECTION
To support or refute a hypothesis, the scientist must collect data. A great deal of logic and effort goes into designing tests to collect data so the data can answer scientific questions. Data is usually collected by experiment or observation. Sometimes improvements in technology will allow new tests to better address a hypothesis.
Observation is used to collect data when it is not possible for practical or ethical reasons to perform experiments. Written descriptions are qualitative data based on observations. This data may also be used to answer questions. Scientists use many different types of instruments to make quantitative measurements. Electron microscopes can be used to explore tiny objects or telescopes to learn about the universe. Probes make observations where it is too dangerous or too impractical for scientists to go. Data from the probes travels through cables or through space to a computer where it is manipulated by scientists.
Experiments may involve chemicals and test tubes, or they may require advanced technologies like a high-powered electron microscope or radio telescope. Atmospheric scientists may collect data by analyzing the gases present in gas samples, and geochemists may perform chemical analyses on rock samples.
A good experiment must have one factor that can be manipulated or changed. This is the independent variable. The rest of the factors must remain the same. They are the experimental controls. The outcome of the experiment, or what changes as a result of the experiment, is the dependent variable. The dependent variable “depends” on the independent variable.
Example: The farmer conducts an experiment on two separate hills. The hills have similar steepness and receive similar amounts of sunshine. On one, the farmer uses a traditional farming technique that includes plowing. On the other, he uses a no-till technique, spacing plants farther apart and using specialized equipment for planting. The plants on both hillsides receive identical amounts of water and fertilizer. The farmer measures plant growth on both hillsides. In this experiment:
- What is the independent variable?
- What are the experimental controls?
- What is the dependent variable?
The independent variable is the farming technique—either traditional or no-till—because that is what is being manipulated. For a fair comparison of the two farming techniques, the two hills must have the same slope and the same amount of fertilizer and water. These are the experimental controls. The amount of erosion is the dependent variable. It is what the farmer is measuring. During an experiment, scientists make many measurements. Data in the form of numbers is quantitative.
Data gathered from advanced equipment usually goes directly into a computer, or the scientist may put the data into a spreadsheet. The data then can be manipulated. Charts and tables display data and should be clearly labeled. Statistical analysis makes more effective use of data by allowing scientists to show relationships between different categories of data. Statistics can make sense of the variability in a data set. Graphs help scientists to visually understand the relationships between data. Pictures are created so that other people who are interested can see the relationships easily.
In just about every human endeavor, errors are unavoidable. In a scientific experiment, this is called experimental error. What are the sources of experimental errors? Systematic errors may be inherent in the experimental setup so that the numbers are always skewed in one direction. For example, a scale may always measure one-half ounce high. The error will disappear if the scale is re-calibrated. Random errors occur because a measurement is not made precisely. For example, a stopwatch may be stopped too soon or too late. To correct for this type of error, many measurements are taken and then averaged. If a result is inconsistent with the results from other samples and many tests have been done, it is likely that a mistake was made in that experiment and the inconsistent data point can be thrown out.
CONCLUSIONS
Scientists study graphs, tables, diagrams, images, descriptions, and all other available data to draw a conclusion from their experiments. Is there an answer to the question based on the results of the experiment? Was the hypothesis supported? Some experiments completely support a hypothesis and some do not. If a hypothesis is shown to be wrong, the experiment was not a failure. All experimental results contribute to knowledge. Experiments that do or do not support a hypothesis may lead to even more questions and more experiments.
Example: After a year, the farmer finds that erosion on the traditionally farmed hill is 2.2 times greater than erosion on the no-till hill. The plants on the no-till plots are taller and the soil moisture is higher. The farmer decides to convert to no-till farming for future crops. The farmer continues researching to see what other factors may help reduce erosion.
THEORY
As scientists conduct experiments and make observations to test a hypothesis, over time they collect a lot of data. If a hypothesis explains all the data and none of the data contradicts the hypothesis, the hypothesis becomes a theory. A scientific theory is supported by many observations and has no major inconsistencies. A theory must be constantly tested and revised. Once a theory has been developed, it can be used to predict behavior. A theory provides a model of reality that is simpler than the phenomenon itself. Even a theory can be overthrown if conflicting data is discovered. However, a longstanding theory that has lots of evidence to back it up is less likely to be overthrown than a newer theory.
Summary
Humans have long tried to interpret the earth in order to improve their chances of survival and ease of life. Different academic disciplines such as biology, history, geography, sociology all attempt to organize human understanding, but from different aspects. History organizes based on time, biology is based on groups of similar living organisms, sociology is based on groups of people. Geography organizes data by location. There is a scientific approach to understanding and explaining locations. The technology of organizing our understanding of locations has become much more sophisticated during the last few decades as remote sensing and geographic information systems have become more popular. Geography is not simply countries and capitals, it is a study of the spatial diversity of all characteristics of the earth including physical components such as volcanoes and hurricanes and the cultural components such as population density and economic development.
