16 Population and Migration
The goals and objectives of this chapter are to:
- Understand the basics of global population distribution.
- Understand population trends and how those impact population growth and dynamics.
- Recognize population change, where those changes occur, and what the implications of population change are for the future of different places around the globe.
- Compare population rates and food production to determine if their is a possible global food shortage or not.
- Demonstrate how the movement of population is affected by both push and pull factors, and explain how these factors are key to understanding new settlement patterns.
Introduction
The purpose of this chapter is to introduce students to the population distribution and growth issues. Geographers study where and why people live in particular locations. Neither people nor resources are distributed uniformly across Earth. In regards to population growth, geographers emphasize three elements: the population size; the rate of increase of world population; the unequal distribution of population growth. Geographers seek to explain why these patterns exist.
The subject of overpopulation can be highly divisive given the deep personal views that many hold on abortion. This course emphasizes a geographic perspective on population growth as a relative concept. Population, from a geography perspective, should be viewed in the context of the availability of resources. Human-environment interaction and overpopulation can be discussed in the contexts of carrying capacity, as well as the relationship between people and resources.
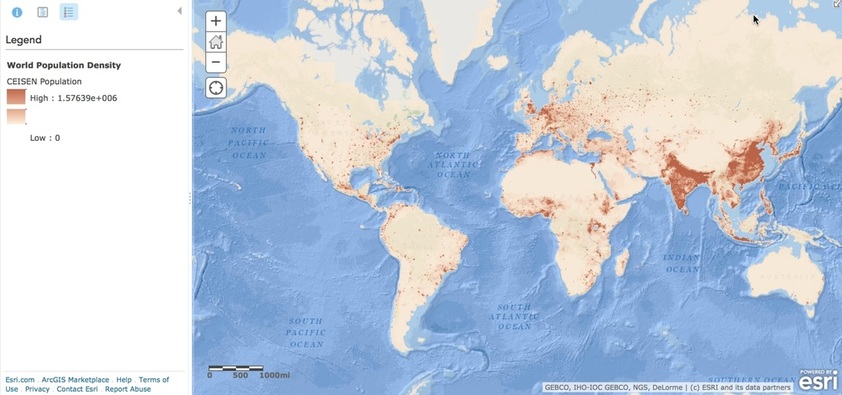
The study of population has never been more important than it is today. There are over 7 billion people on the planet, but the majority of this growth has occurred in the last 100 years, mostly in developing nations. Humans do not live uniformly around the planet, but rather in clusters because of earth’s physical geography. Environments that are too dry, wet, cold, or mountainous create a variety of limiting factors to humans. Two-thirds of the world’s population is located within four major clusters: East Asia (China), South Asia (India and Indonesia), Southeast Asia, and Europe, with the majority in East and South Asia.
Demographers, scientists that study population issues, and other scientists say there is more to the story than simple population growth. Ecologists believe that humans have out-grown the Earth’s carrying capacity, which is a scientific way of saying that the planet can no longer sustain or support human activity. Simply put, there is just not enough of the world’s resources to give every human a standard of living expected by most Americans. If fact, if all 7 billion people on the planet lived the average American lifestyle, it would require over three Earth’s. This raises several issues: that the planet cannot sustain a population of 7 billion, though we are expected to reach 9 billion by 2100, and that the planet cannot sustain Western lifestyles for the entire planet.
Some useful websites:
Distribution of the World’s Population
It has been argued that the world can’t support all the humans on the planet. On some level that’s true and on another it is not. For example, we could actually pack all 7 billion humans in California, but that’s not desirable, sanitary, or sustainable. The reality is that humans cannot live in many parts of the world due to moisture, temperature, or growing season issues. For example, 20 percent of the world is too dry to support humans. This mostly has to do with high pressure systems around 30 degrees north and south of the equator where constant sunny conditions have created some of the world’s largest deserts. Some of these include the Sahara, Arabian Peninsula, Thar, Takla Makan, and Gobi deserts. Most deserts do not provide enough moisture to support agriculture for large populations. Those who do live in these regions tend to raise animals and are considered nomads.
Regions that receive too much moisture also cause problems for human settlement. These are tropical rainforest regions located between the Tropic of Cancer (23.5 degrees North) and the Tropic of Capricorn (23.5 degrees South). The problem with these regions of the world has to do with the soil erosion due to high precipitation. High levels of precipitation greatly hinder agricultural production because nutrients in the soil are quickly washed away. This is partly why slash-and-burn agriculture occurs in these regions. Locals will burn part of the forest to put nutrients back into the ground. This only works for a short period of time because the precipitation washes away nutrients within a few years, so farmers move on to other parts of the forest with their slash-and-burn practices.
Additionally, regions that are too cold pose problems for large population clusters and food production. The cold polar regions have a short growing season and many of the polar regions have limited amounts of moisture because they are covered by high pressure systems (much like the desert regions). Thus, cold polar regions are not only limited by temperature, they are also limited by lack of moisture despite access to snow, ice, and glaciers. Mountainous and highland regions lack population clusters for similar reasons: steep slopes, snow and ice cover, and short growing seasons.
Population Profiles
Demographers use various ways to measure and analyze population density. The arithmetic density, also called population density, of a population is the total number of people in proportion to the area of land (land size). But that’s not the best indicator of population density because there are many environments humans can’t live well in (i.e. deserts, arctic, tropical forests, etc.). Plus it doesn’t consider if the ground is usable for producing food. The physiological density of a population is the total population in proportion to the area of arable land suited for agriculture. Even more specifically, agricultural density refers to the amount of farmers valuable to arable land. A high agricultural density suggests that the available agricultural land used for farming and the farmers who are capable of producing and harvesting food is reaching its limit for that region. If the demand for food continues or rises, the risk is that there will not be enough arable land to feed their people. In contrast, an area with a low agricultural density actually has a higher potential for agricultural production. Economically, a low agricultural density would be favorable for future growth.
Population Pyramids
 A useful and key tool used by scientists that focus on demographics, this included geographers, demographers, and social scientists, is a population profile (also called a population pyramid). A population profile visually demonstrates a particular region’s demographic structure in relation to males and females, and is often expressed in numbers or percentages. The following are some characteristics of population profiles:
- A bell-shaped graph will indicate that a country has experienced high population growth in the early past but is experiencing a slow decrease.
- Narrow triangles show countries with high population growth.
- As a country’s population boom begins to age, a strange profile shape can develop with a wider top and a narrower base.
- Populations that have stabilized have profiles where the bulge is of past high birth rates migrates to older populations moderately and not quickly, while the base has a moderately smaller but not dramatic base.
- When a country has a large immigrant population, specifically “guest workers” than usually tend to be men, the male side of the graph will be dramatically wider than the women side of the graph.
- If a country has experienced war, a catastrophic disaster, or a genocide that eliminates an entire generation, that generation will have a smaller number or percent than the generations before or after. For example, a major war may cause a reduction in populations in their mid-20s and 30s, which would appear on the profile graph.
Click here for a great, interactive website on population pyramids around the world.
Global Population Trends
 |
 |
 |
A region’s population will grow as long as their crude birth rates are greater than their crude death rates.
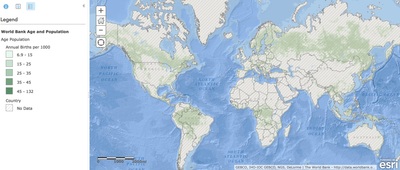
A crude birth rate (CBR) is the total number of live births for every 1,000 people in a given year. So a crude birth rate of 10 would mean 10 babies are born every year for every 1,000 people in that region.
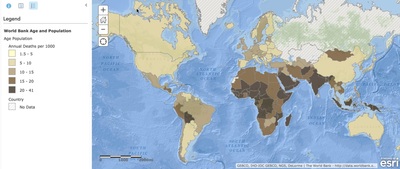
Crude death rates (CDR) are the total number of deaths per 1,000 people in a given year. Click on the sequence of maps above to make them bigger to view. When CBRs are compared to CDRs, a region’s natural increase rate can be determined.
A natural increase rate (NIR) is the percent a population will grow per year, excluding annual migration. Usually a NIR of 2.1 is required to maintain or stabilize a region’s population. Any more than that and the population will grow, any less than an NIR of 2.1 causes population contraction. The reason why the NIR percent is 2.1 and not 2.0 for stability is because not every human will pair up and have a child because of genetics, choice, or death before child bearing years. Once we know the NIR, we can determine doubling time.
Doubling time is the how may years would it take for a defined population to double in size, assuming that NIR stays the same over time. Currently about 82 million people are added to world’s global population every year.
STRUCTURAL CHANGES OF POPULATIONS
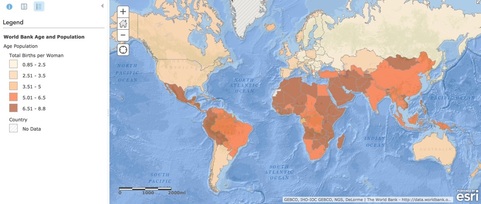
Before we look at the model used to analyze how populations change, it’s important to look at key factors that influence the structure of a population The first is called the total fertility rate (TFR). The TFR is the average number of children a woman would be expected to have during childbearing years (between 15-49 years old). The global average for TFRs is about 2.5, but in less developed countries it’s as high as 5.0 or higher and in more developed countries it’s as low as 2.0 or less. The total fertility rate is a direct expression of a nation’s health care system because it reflects a population’s access to doctors, nurses, hospitals, and medicine.
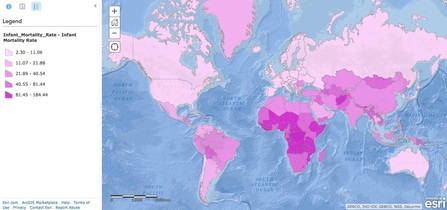
The next important term to understand is the infant mortality rate (IMR). The IMR is determined by calculating how many children die before the age of 1 per 1,000 live births annually. The highest IMRs are in less developed countries where rates can be as high as 80 or more. Conversely, in place like Europe it’s as low as 5.
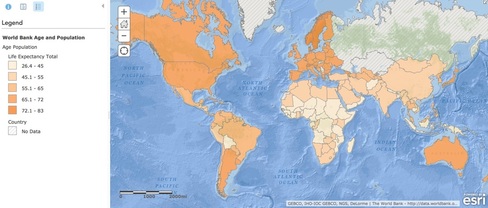
Life expectancy at birth is pretty straight forward—it’s an average of how many years a newborn is expected to live, assuming that mortality rates stay consistent. In more developed countries, the average life expectancy is over 80 years old and in less developed countries it is only around 40 years. When we compare CBRs, CDRs, and TFRs, we find that the world has a large population of youth with the largest percent in less developed countries. This causes great stress on the education systems and to some extent the health care systems within poorer countries. But more developed countries tend to have older demographics, which tends to cause stresses on the health care and social safety nets of those countries. The dependency ratio, discussed later in this chapter, is used to understand these stresses and is the number of people who are too young or too old to work compared to the number of people who are in their “productive years.” The larger the ratio, the greater the economic stress on those nations.
Demographic Transition Model
Human geographers have determined that all nations go through a four-stage process called the demographic transition model (DTM). The DTM’s function is to demonstrate the natural sequence of population change over time based on development and modernization. This can help geographers and other scientists examine the causes and consequences of fertility, mortality, and natural increase rates. Though controversial, the DTM has been used as the benchmark for forecasting human population growth regionally and globally.

STAGE 1: LOW GROWTH RATE
We have lived in the first stage of the DTM for most of human existence. In this first stage, CBRs and CDRs fluctuated greatly regionally, globally, and over time because of living conditions, food output, environmental conditions, war, and disease. But ultimately, the natural increase of the world was pretty stable because CBRs and CDRs where about equal. But around 8,000 BC, the world’s population began to grow dramatically due to the agricultural revolution. During this time, humans learn to domesticate plants and animals for personal use and became less reliant on hunting and gathering for sustenance. This allowed for more stable food production and allowed village populations to grow. Yet, war and disease prevented population growth to truly occur on a global scale.
STAGE 2: HIGH GROWTH RATE
Around the mid-1700s, global populations began to grow 10 times faster than in the past for two reasons: the Industrial Revolution and increased wealth. The Industrial Revolution brought with it a variety of technological improvements in agricultural production and food supply. Increased wealth in Europe, and later North America, because of the Industrial Revolution meant that more money and resources could be devoted to medicine, medical technology, water sanitation, and personal hygiene. Sewer systems were installed in cities, thus public health improved. All of this dramatically caused CDRs to drop around the world. At first, CBRs stayed high as CDRs dropped, this caused populations to increase in Europe and North America. Over time, this would change.
Africa, Asia, and Latin America moved into Stage 2 of the demographic transition model 200 years later for different reasons than their European and North American counterparts. The medicine created in Europe and North America was brought into these less developed nations creating what is now called the medical revolution. This revolution, or diffusion of medicine to this region caused death rates to drop quickly. While the medical revolution reduced death rates, it did not bring with it the wealth and improved living conditions, and development that the Industrial Revolution created. Global population growth is greatest in the regions that are still in Stage 2.
STAGE 3: MODERATE GROWTH RATE
Today, Europe and North America have moved to Stage 3 of the demographic transition model. A nation moves from Stage 2 to Stage 3 when CBRs begin to drop while CDRs remain low or even continue to fall. It should be noted that the natural rate of increase in nations within Stage 3 is moderate because CBRs are somewhat higher than CDRs. The United Sates, Canada, and nations in Europe entered this stage in the early 20th Century. Latin American nations entered this stage later in the century.Advances in technology and medicine cause decreases in IMR and overall CDR during Stage 2. Social and economic changes bring about a decrease in CBR during Stage 3. Nations that begin to acquire wealth tend to have fewer children as they move away from rural-based development structures toward urban-based structures because more children survive childhood and the need for large families for agricultural work decreases. Additionally, women gain more legal rights and chose to enter the workforce, own property, and have fewer children as nations move into Stage 3.
STAGE 4: LOW GROWTH RATE
A nation enters Stage 4 of the demographic transition model when CBRs equal to or become less than CDRs. When CBRs are equal to CDRs, a nation will experience zero population growth (ZPG). NOTE: Sometimes a nation could have a slightly higher CBR, but still experience ZPG. This occurs in many countries where girls do not live as long before they reach their childbearing years due to gender inequality. When a country enters Stage 4, the population ages meanwhile fewer children are born. This creates a great strain on the social safety net programs of a country as is tries to support older citizens who are no longer working and contributing to the economy. Most of Europe has entered Stage 4. The United States would be approaching this stage if it weren’t for migration into the country. A nation in the first two stages of the transition model will have a large base of young people and smaller proportion of older people. A nation in the Stage 4 will have a much smaller base of young people (less children), but a much larger population of elderly (decreased CDR). A nation with a large youth population is more likely to be rural with high birthrates and possibly high death rates. This can tell geographers a lot about the health care system of that nation. Moreover, a nation in Stage 4 with a large elderly population will have much fewer young people supporting the economy. These two examples represent the dependency ratio, mentioned earlier in this chapter. This ratio is the number of people – young and old – who are dependent on the working force.
Human geographers like to focus on the following demographic groups: 0-14 years old, 15-64 years old, and 65 and older. Individuals who are 0-14 and over 65 are considered dependents (though this is changing in older generations). One third of all young people live in less developed nations (LDN). and this places great strain on those nations infrastructure such as schools, hospitals, and day-care. Older individuals in more developed nations (MDL) benefit from health care services, but require more help and resources from the government and economy. Another ratio geographers look at is the number of males compared to females. This is called the sex ratio. Globally, more males are born than females but males have a higher death rate than females. But understanding a nation’s sex ratio and their dependency ratio helps human geographers analyze fertility rates and natural increase.
As noted earlier, population growth has increased dramatically in the last century. No country is still in Stage 1 and very few have moved in to Stage 4. The majority of the world is either in Stage 2 or 3 which both have higher CBRs than CDRs. This is why the world’s population is over 7 billion today.In summary, the demographic transition model is a model that helps human geographers understand and predict the demographics of individual nations. In Stage 1, CBR and CDR are very high and thus produce a low natural increase. In Stage 2, a nation’s CBR stays relatively high but the CDR drops dramatically, producing the highest growth in population. In Stage 3, CDR stays low; however, changes in social customs and economic conditions. Finally, nations in Stage 4 have nearly equal CBR and CDR (sometimes higher CDR), creating a drop in natural increase.
Human Overpopulation
OVERPOPULATION CONCERNS
In 1798, Thomas Malthus published a short but revolutionary work called “An Essay on the Principle of Population.” Malthus states that future population growth would be determined by two facts and one opinion. The facts were that food is necessary for survival and that men and women would continue to have sex, thus producing offspring. His opinion is that if population is not restrained by war, famine, and/or disease, population growth would occur exponentially. An example of exponential growth is 2, 4, 8, 16, 32, 64, 128, 256, 512, 1024 and so on. He also argues that agricultural production of food could only grow arithmetically. An example of arithmetic growth is 1, 2, 3, 4, 5, 6, 7 and so on.
The overall assumption is that population growth will quickly grow beyond food production leading to food shortages and famines. Malthus’ theory has not come to fruition, yet, due to technological advances in agriculture (fertilizers, insect and drought resistance and better farming techniques). Some discredit Malthus because his hypothesis is based on a world supply of resources being fixed rather than expanding. Humans have the ability to expand the supply of food and other resources by using new technologies to offset scarcity of minerals and arable land. Thus, we can use resources more efficiently and substitute new resources with scarce ones. Even with a global human population of 7 billion, food production has grown faster than the global rate of increase (NIR). Better growing techniques, higher-yielding and genetically modified seeds, as well as cultivation of more land have helped expand food supplies.
While new technologies have helped to increase food production, there are not enough emerging technologies to handle supply and demand. Adding to the problem is the fact that many insects have developed a resistance to pesticides. These problems have cause a slow down and leveling off of food production in many regions of the world. Without breakthroughs in safe and sustainable food production, food supply will not keep up with population growth. Others believe that population growth isn’t a bad thing. A large population could stimulate economic growth, and therefore, production of food. Population growth could generate more customers and more ideas for improving technology. Additionally, some maintain that no cause-and-effect relationship exists between population growth and economic development. They argue that poverty, hunger, and other social welfare problems associated with lack of economic development, famines, and war are a result of unjust social and economic institutions, not population growth.
In the last few decades, there has been a rise in neo-Malthusians (new or recent supports of Malthus). One notable figure is Paul Ehrlich. In his very popular book, The Population Bomb, Ehrlich argues that population growth cannot continue without controls because the planet will reach the carrying capacity of our species. In short, we must consider environmental factors as we discuss overpopulation concerns. For example, even though humans produce four times the amount of food that we consume, we produce our food at the price of the environment. The rapid population growth of the world has caused massive deforestation in the Boreal Forests and rainforests, increasing desertification that encroaches into arable land, over-fishing of the oceans, mass extinction of species, air and water pollution, and anthropogenic (human-induced) climate change. All of these things have economic and environmental costs that we must consider.
FUTURE OF POPULATION GROWTH
Governments and other entities have the ability to dramatically influence population change as a way to increase or decrease population growth in a particular country. For example, some countries take dramatic steps to reduce their population. China’s One-Child Policy dictated that each family (husband and wife) could legally have only one child. Families that followed this policy were often times given more money by the government or better housing. If a family illegally had another child, the family would be fined heavily. Children born illegally can not attend school and have a difficult time finding jobs, getting government licenses, or even getting married. Some have reported that the government would force abortions on families with more than one child. One of the major consequences of this policy was a dramatic increase in abortions and infanticides, especially of females. Female infanticide is linked directly to a global cultural trend that privileges males over females—baby boys are desired, especially if the family is only allowed one child. This specific focus on eliminating women is called gendercide. Half the Sky, written by Nicholas Kristof and Sheryl WuDunn, documents global gendercide and what is being done to combat this problem. After the two great world wars, the United Nations Population Commission and the International Planned Parenthood Federation began to advocate for more global population control. Many groups who advocate for population control focus on:
- Changing cultural attitudes that keep population rates high (or low)
- Providing contraception to LDCs
- Helping countries study population trends by improving census counts
- Empowering women and emphasizing gender equality
It is believed that worldwide, over 60 percent of women between ages 15-49 use some form of contraception. This varies regionally. In the United States contraception use is at nearly 75 percent, whereas in Africa it is around 30 percent. The general consensus today is that the focus on population planning should be on gender equality and improving the social status of women around the world. This is the focus of the International Conference on Population and Development.Religious organizations are also concerned with population growth; however, they focus on contraception issues and not strictly population growth. Some religions and political entities find contraception use immoral which has influenced some governments to make the access to them and use of them illegal. Urbanization and empowering women seems to have the greatest impact in reducing fertility rates. China’s fertility rate began dropping before the one-child policy was implemented. Recent attempts to allow or encourage more births in China and other countries have had minimal effect.
Migration Geography
Some interesting patterns occur with migration. Most people that migrate travel only a short distance from their original destination and usually within their country, usually due to economic factors. This is called internal migration. Internal migration can be divided up even further into interregional migration (the permanent movement from one region of a country to another region) and intraregional migration (the permanent movement within a single region of a country).The other type of migration is called international migration, which is the movement from one country to another. Some people are allowed to voluntarily migration based on individual choice. At other times, an individual leaves against his or her will. This is forced migration. Ultimately, the distance people migrate is depends on economic, gender, family-status, and cultural factors. For example, long-distance migration tends to involve males looking for employment and traveling by themselves rather than risk taking their families.
Migration is very dynamic around the world with peaks in different regions at different times. As noted earlier, there are several reasons why people migrate, but where are people migrating to or from? Migration transition is the change in migration patterns within a society caused by industrialization, population growth, and other social and economic changes that also produce the demographic transition. A critical factor in all forms of migration is mobility—the ability to move either permanently or temporarily. There has been a dramatic increase of immigration into the United States from Latin America, Africa and the Middle East. Some from these regions migrate to the U.S. out of economic necessity. We hear quite a lot about guest workers in the United States. These are individuals who migrate temporarily to take up jobs in other countries. Others migrate to escape conflicts such as the civil wars in Somalia, Sudan, and Ethiopia. Genocides in Rwanda (1994) and more recently Darfur, Sudan have forced internal and international migration. The wars in Afghanistan and Iraq have also forced migration from these regions. Washington Post reporter Sudarsan Raghavan reported on February 4, 2007 that the U.N. High Commission for Refugees estimates that over 2 million Iraqis (nearly 8 percent of the pre-war population) have been forced to migrate to nearby nations of Jordan, Syria, and Lebanon.
There are several reasons why people migrate and these are called push and pull factors and they occur on economic, cultural, or environmental lines. Push factors are events and conditions that compel an individual to move from a location. Pull factors are conditions that influence migrants to move to a particular location. The number one reason why people migrate is for economic reasons. This is because people either get “pushed” away from where they live due to a lack of employment opportunities, or pulled because somewhere else either offers more jobs/higher paying jobs.Cultural push factors usually involve slavery, political instability, ethnic cleansing, famine, and/or war. People who choose to flee or are forced to flee as a result of these problems are often refugees. The United States Committee for Refugees classifies a refugee as someone who has been forced from their homes and can not return because of their religion, race, nationality, or political opinion. In 2010, the United Nations High Commission for Refugees estimated that there are over 44 million people worldwide that have been forcibly displaced. The number grows to another 27 million when you consider internally displaced persons (IDPs). Cultural pull factors could include people who want to live in democratic societies, gender equality, or educational or religious opportunities. A variety of environmental push and pull factors also influence migration patterns. Environmental pull factors can include people wanting to live in particular environments. For example, many elderly people like to live in St. George because they prefer the recreational opportunities that are provided for retired individuals. Some people want to live where snow activities are available or near an ocean. Push factors often are related to the frequency of natural disasters such as earthquakes, tsunamis, hurricanes, or flash floods that a region could experience. Climatic push/pull factors, such as droughts, also influence migration patterns. A very recent example of this is the famine in Somalia. US AID and the Famine Early Warning System track potential famines globally so that relief organizations can have a heads up and be more proactive when events occur. People who have been pushed for environmental reasons are called environmentally displaced persons (also called environmental refugees). The problem with these refugees is that they are not protected or given the same rights under the 1951 Refugee Convention. Under the convention, a refugee is a person with: “well-founded fear of being persecuted for reasons of race, religion nationality, membership of a particular social group or political opinion, who is outside the country of his nationality ad is unable o, owing to such fear, is unwilling to avail himself of the protection of that country.” But more and more people are becoming environmental refugees because of climate change, droughts, flooding from massive storm systems, water shortages, and more.
Summary
The issue of global human populations is often times controversial because there is no clear consensus on how to deal with it. What demographers do know is that there are over 7.3 billion on the planet, but they are not evenly distributed evenly around the world. One global pattern that is consistent is water; nearly 80 percent of the world’s population lives near a large body of water. There are a variety of ways that geographers and demographers study population dynamics and profiles, often times representing this data in the form of diagrams, graphs, and most importantly maps. One way social scientists have tried to describe historical, current, and future population trends is with the Demographic Transition Model. The model tries to describe how more developed countries progressed with their demographics through as compared to less developed countries today. But some argue that though the model predicts demographic trends in North America and Europe, the model does not accurately represent population trends other regions of the world. Others say the model is too simplistic because environmental and cultural factors are not considered. Another area of debate is what the potential ramifications could be as the human population exceeds past 8 and 9 billion by 2050. This debate started a while ago with the Malthus theory. Many ecologists believe humans have reached the earth’s carrying capacity and can not sustain such large populations. Other argue that technology has consistently kept ahead of food scarcity concerns and that high populations could actually be a benefit for less developed countries as a way to improve development. Geographers also understand that humans are migrating species and with technology today can move across great distances. The reason for migration varies, but it all comes down to push or pull factors related to economic, political, social, or environmental reason. Many of these travelers are temporary living as guest workers until they need to move on. Today, many migrants are refugees, living in a variety of living conditions from complex metropolitans to squatter towns or refugee camps. But one thing we do know about human migration is that the majority of humans will die in the same town they were born in.
