Learning Objectives
- Be able to state how certain properties of atoms vary based on their relative position on the periodic table.
One of the reasons the periodic table is so useful is because its structure allows us to qualitatively determine how some properties of the elements vary versus their position on the periodic table. The variation of properties versus position on the periodic table is called periodic trends. There is no other tool in science that allows us to judge relative properties of a class of objects like this, which makes the periodic table a very useful tool. Many periodic trends are general. There may be a few points where an opposite trend is seen, but there is an overall trend when considered across a whole row or down a whole column of the periodic table.
Effective Nuclear Charge
Many of the periodic properties of atoms depend on electron configuration; in particular, the valence electrons and their level of attraction to the nucleus.
Valence electrons are simultaneously attracted to the positive charge of the nucleus and screened (repelled) by the negative charges of other electrons. This net nuclear charge felt by valence electrons is known as its effective nuclear charge, Zeff (pronounced “z-effective”). The effective nuclear charge is always less than the actual nuclear charge, and can be roughly estimated using the following equation:
[latex]Z_{\text{eff}}=Z-S[/latex]
Where Z is the nuclear charge (equal to the number of protons), and S is the screening constant which can be approximated to the number of non-valence or “core” electrons.
For example: try to approximate the effective nuclear charge of magnesium.
First, we must determine the electron configuration of magnesium to determine the number of core electrons:
[latex]\ce{Mg}=1s^22s^22p^63s^2=[\ce{Ne}]3s^2[/latex]
Therefore, magnesium has 10 core electrons from its 1s2, 2s2, and 2p6 orbitals.
Magnesium is element 12, so it has 12 protons and a nuclear charge of 12:
[latex]\begin{array}{l} Z_{\text{eff}}=12-10 \\ Z_{\text{eff}}=\phantom{1}2+ \end{array}[/latex]
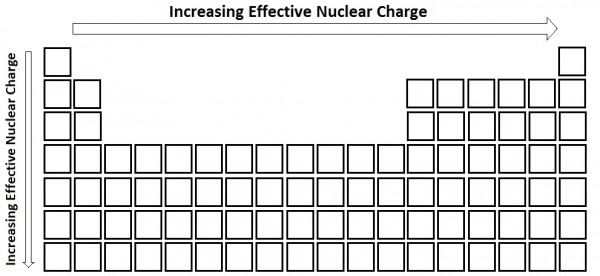
Moving left to right across a period on the periodic table, each subsequent element has an additional proton and valence electron, but the core electrons which are responsible for the majority of screening remain the same. This results in a trend that in general the effective nuclear charge increases from left to right across any period of the periodic table.
Moving from top to bottom down a column of the periodic table, we might expect the elements to have a similar effective nuclear charge as they all have the same number of valence electrons. However, we actually see a slight increase in Zeff moving down a column of the periodic table. As the principal quantum number (n) increases, the orbital size increases making the core electron clouds more spread out. These core electron clouds that are more diffuse do not screen as well, giving a slight increase to Zeff (see Figure 2.21 “Increasing Effective Nuclear Charge”).
Atomic Radii
The atomic radius is an indication of the size of an atom. Although the concept of a definite radius of an atom is a bit fuzzy, atoms behave as if they have a certain radius. Such radii can be estimated from various experimental techniques, such as the x-ray crystallography of crystals.
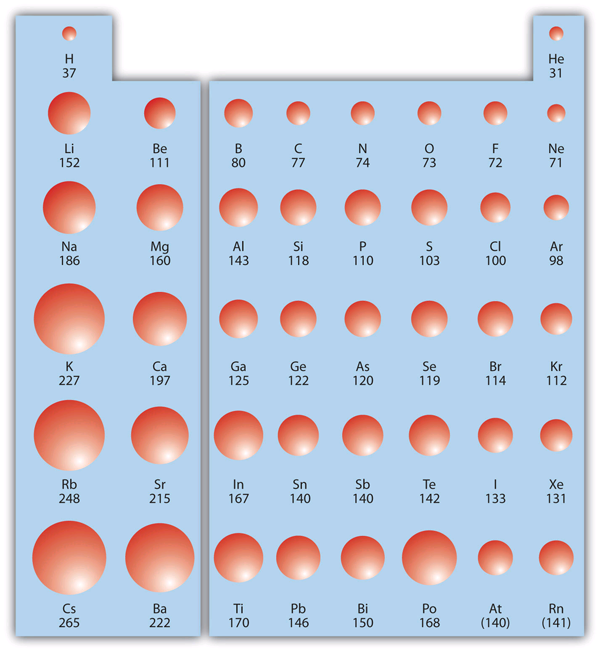
As you go down a column of the periodic table, the atomic radii increase. This is because the valence electron shell is getting a larger and there is a larger principal quantum number, so the valence shell lies physically farther away from the nucleus. This trend can be summarized as follows:
[latex]\text{as }\downarrow\text{PT, atomic radius}\uparrow[/latex]
Where PT stands for “periodic table.” Going across a row on the periodic table, left to right, the trend is different. This is because although the valence shell maintains the same principal quantum number, the number of protons — and hence the nuclear charge — is increasing as you go across the row. The increasing positive charge leads to a larger effective nuclear charge which casts a tighter grip on the valence electrons, so as you go across the periodic table, the atomic radii decrease. Again, we can summarize this trend as follows:
[latex]\text{as }\rightarrow\text{PT, atomic radius}\downarrow[/latex]
Figure 2.22 “Atomic Radii Trends on the Periodic Table” shows spheres representing the atoms of the s and p blocks from the periodic table to scale, showing the two trends for the atomic radius.
Example 2.8
Problems
Referring only to a periodic table and not to Figure 2.18 “Atomic Radii Trends on the Periodic Table,” which atom is larger in each pair?
- Si or S
- S or Te
Solutions
- Si is to the left of S on the periodic table, so it is larger because as you go across the row, the atoms get smaller.
- S is above Te on the periodic table, so Te is larger because as you go down the column, the atoms get larger.
Test Yourself
Referring only to a periodic table and not to Figure 8.24 “Atomic Radii Trends on the Periodic Table,” which atom is smaller, Ca or Br?
Answer
Br
Ionization Energy
Ionization energy (IE) is the amount of energy required to remove an electron from an atom in the gas phase:
[latex]\ce{A(g)}\rightarrow \ce{A^+(g)}+\text{e}^-\hspace{10 mm} \Delta H\equiv \text{IE}[/latex]
IE is usually expressed in kJ/mol of atoms. It is always positive because the removal of an electron always requires that energy be put in (i.e., it is endothermic). IE also shows periodic trends. As you go down the periodic table, it becomes easier to remove an electron from an atom (i.e., IE decreases) because the valence electron is farther away from the nucleus. Thus:
[latex]\text{as }\downarrow\text{PT, IE}\downarrow[/latex]
However, as you go across the periodic table and the electrons get drawn closer in, it takes more energy to remove an electron; as a result, IE increases:
[latex]\text{as }\rightarrow\text{PT, IE}\uparrow[/latex]
Figure 2.23 “Ionization Energy Trends on the Periodic Table” shows values of IE versus position on the periodic table. Again, the trend isn’t absolute, but the general trends going across and down the periodic table should be obvious.

IE also shows an interesting trend within a given atom. This is because more than one IE can be defined by removing successive electrons (if the atom has them to begin with):
[latex]\begin{array}{rlrl} \text{IE}_1&\ce{A(g)}&\rightarrow&\ce{A^{\phantom{1}+}(g)}+\text{e}^- \\ \text{IE}_2&\ce{A^+(g)}&\rightarrow&\ce{A^{2+}(g)}+\text{e}^- \\ \text{IE}_3&\ce{A^{2+}(g)}&\rightarrow&\ce{A^{3+}(g)}+\text{e}^- \end{array}[/latex]
And so forth.
Each successive IE is larger than the previous because an electron is being removed from an atom with a progressively larger positive charge. However, IE takes a large jump when a successive ionization goes down into a new shell. For example, the following are the first three IEs for Mg, whose electron configuration is 1s22s22p63s2:
[latex]\begin{array}{llrl} \text{IE}_1=\phantom{1, }738\text{ kJ/mol}&\ce{Mg(g)}&\rightarrow&\ce{Mg^{\phantom{1}+}(g)}+\text{e}^- \\ \text{IE}_2=1,450\text{ kJ/mol}&\ce{Mg^+(g)}&\rightarrow&\ce{Mg^{2+}(g)}+\text{e}^- \\ \text{IE}_3=7,734\text{ kJ/mol}&\ce{Mg^{2+}(g)}&\rightarrow&\ce{Mg^{3+}(g)}+\text{e}^- \end{array}[/latex]
The second IE is twice the first, which is not a surprise: the first IE involves removing an electron from a neutral atom, while the second one involves removing an electron from a positive ion. The third IE, however, is over five times the previous one. Why is it so much larger? Because the first two electrons are removed from the 3s subshell, but the third electron has to be removed from the n = 2 shell (specifically, the 2p subshell, which is lower in energy than the n = 3 shell). Thus, it takes much more energy than just overcoming a larger ionic charge would suggest. It is trends like this that demonstrate that electrons are organized in atoms in groups.
Example 2.9
Problems
Which atom in each pair has the larger IE?
- Ca or Sr
- K or K+
Solutions
- Because Sr is below Ca on the periodic table, it is easier to remove an electron from it; thus, Ca has the higher IE.
- Because K+ has a positive charge, it will be harder to remove another electron from it, so its IE is larger than that of K. Indeed, it will be significantly larger because the next electron in K+ to be removed comes from another shell.
Test Yourself
Which atom has the lower ionization energy, C or F?
Answer
C
Electron Affinity
The opposite of IE is described by electron affinity (EA), which is the energy change when a gas-phase atom accepts an electron:
[latex]\ce{A(g)}+\text{e}^-\rightarrow \ce{A^-(g)}\hspace{10 mm}\Delta H\equiv \text{EA}[/latex]
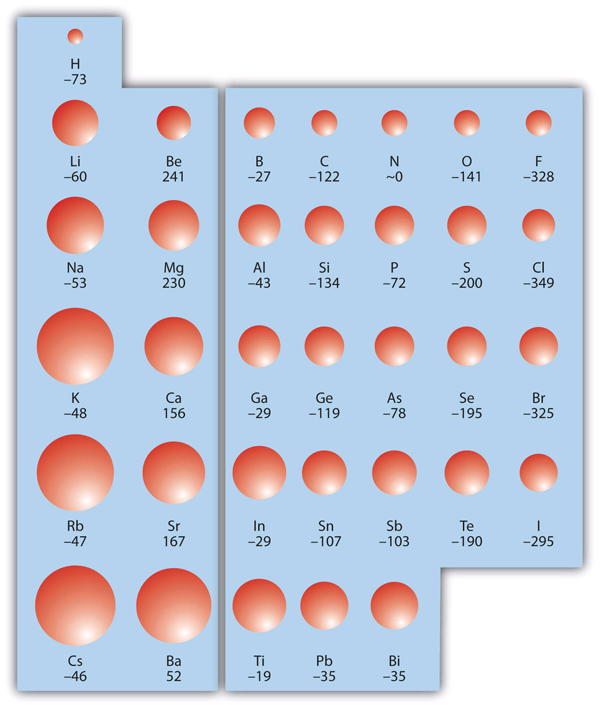
EA is also usually expressed in kJ/mol. EA also demonstrates some periodic trends, although they are less obvious than the other periodic trends discussed previously. Generally, as you go across the periodic table, EA increases its magnitude:
[latex]\text{as }\rightarrow\text{PT, EA}\uparrow[/latex]
There is not a definitive trend as you go down the periodic table; sometimes EA increases, sometimes it decreases. Figure 2.24 “Electron Affinity on the Periodic Table” shows EA values versus position on the periodic table for the s– and p-block elements. The trend isn’t absolute, especially considering the large positive EA values for the second column. However, the general trend going across the periodic table should be obvious.
Example 2.10
Problems
Predict which atom in each pair will have the highest magnitude of EA.
- C or F
- Na or S
Solutions
- C and F are in the same row on the periodic table, but F is farther to the right. Therefore, F should have the larger magnitude of EA.
- Na and S are in the same row on the periodic table, but S is farther to the right. Therefore, S should have the larger magnitude of EA.
Test Yourself
Predict which atom will have the highest magnitude of EA, As or Br.
Answer
Br
Key Takeaways
- Certain properties — notably effective nuclear charge, atomic radius, IE, and EA — can be qualitatively understood by the positions of the elements on the periodic table.
Exercises
Questions
- Write a chemical equation with an IE energy change.
- Write a chemical equation with an EA energy change.
- State the trends in atomic radii as you go across and down the periodic table.
- State the trends in IE as you go across and down the periodic table.
- Which atom of each pair is larger?
- Na or Cs
- N or Bi
- Which atom of each pair is larger?
- C or Ge
- Be or Ba
- Which atom of each pair is larger?
- K or Cl
- Ba or Bi
- Which atom of each pair is larger?
- Si or S
- H or He
- Which atom has the higher IE?
- Na or S
- Ge or Br
- Which atom has the higher IE?
- C or Ne
- Rb or I
- Which atom has the higher IE?
- Li or Cs
- Se or O
- Which atom has the higher IE?
- Al or Ga
- F or I
- A third-row element has the following successive IEs: 738; 1,450; 7,734; and 10,550 kJ/mol. Identify the element.
- A third-row element has the following successive IEs: 1,012; 1,903; 2,912; 4,940; 6,270; and 21,300 kJ/mol. Identify the element.
- For which successive IE is there a large jump in IE for Ca?
- For which successive IE is there a large jump in IE for Al?
- Which atom has the greater magnitude of EA?
- C or F
- Al or Cl
- Which atom has the greater magnitude of EA?
- K or Br
- Mg or S
Answers
- [latex]\ce{Na(g)}\rightarrow \ce{Na^+(g)}+\text{e}^-\hspace{10 mm}\Delta H=\text{IE (answers will vary)}[/latex]
- As you go across, atomic radii decrease; as you go down, atomic radii increase.
-
- Cs
- Bi
-
- K
- Ba
-
- S
- Br
-
- Li
- O
- Mg
- The third IE shows a large jump in Ca.
-
- F
- Cl
Long Descriptions
Chart of atomic radii trends on the periodic table. The data has been compiled in the following table:
| Row | Element | Atomic Radius (picometres) |
|---|---|---|
| First | H | 37 |
| First | He | 31 |
| Second | Li | 152 |
| Second | Be | 111 |
| Second | B | 80 |
| Second | C | 77 |
| Second | N | 74 |
| Second | O | 73 |
| Second | F | 72 |
| Second | Ne | 71 |
| Third | Na | 186 |
| Third | Mg | 160 |
| Third | Al | 143 |
| Third | Si | 118 |
| Third | P | 110 |
| Third | S | 103 |
| Third | Cl | 100 |
| Third | Ar | 98 |
| Fourth | K | 227 |
| Fourth | Ca | 197 |
| Fourth | Ga | 125 |
| Fourth | Ge | 122 |
| Fourth | As | 120 |
| Fourth | Se | 119 |
| Fourth | Br | 114 |
| Fourth | Kr | 112 |
| Fifth | Rb | 248 |
| Fifth | Sr | 215 |
| Fifth | In | 167 |
| Fifth | Sn | 140 |
| Fifth | Sb | 140 |
| Fifth | Te | 142 |
| Fifth | I | 133 |
| Fifth | Xe | 131 |
| Sixth | Cs | 265 |
| Sixth | Ba | 222 |
| Sixth | Ti | 170 |
| Sixth | Pb | 146 |
| Sixth | Bi | 150 |
| Sixth | Po | 168 |
| Sixth | At | (140) |
| Sixth | Rn | (141) |
Chart of ionization energy on the periodic table. The data has been compiled in the following table:
| Row | Element | Ionization Energy (kJ/mol) |
|---|---|---|
| First | H | 1312 |
| First | He | 2372 |
| Second | Li | 520 |
| Second | Be | 111 |
| Second | B | 800 |
| Second | C | 1086 |
| Second | N | 1402 |
| Second | O | 1214 |
| Second | F | 1681 |
| Second | Ne | 2080 |
| Third | Na | 496 |
| Third | Mg | 160 |
| Third | Al | 578 |
| Third | Si | 786 |
| Third | P | 1012 |
| Third | S | 1000 |
| Third | Cl | 1251 |
| Third | Ar | 1520 |
| Fourth | K | 419 |
| Fourth | Ca | 197 |
| Fourth | Ga | 579 |
| Fourth | Ge | 762 |
| Fourth | As | 946 |
| Fourth | Se | 940 |
| Fourth | Br | 1140 |
| Fourth | Kr | 1350 |
| Fifth | Rb | 403 |
| Fifth | Sr | 550 |
| Fifth | In | 558 |
| Fifth | Sn | 708 |
| Fifth | Sb | 833 |
| Fifth | Te | 870 |
| Fifth | I | 1008 |
| Fifth | Xe | 1170 |
| Sixth | Cs | 376 |
| Sixth | Ba | 503 |
| Sixth | Ti | 590 |
| Sixth | Pb | 715 |
| Sixth | Bi | 703 |
| Sixth | Po | 812 |
| Sixth | At | 800 |
| Sixth | Rn | 1040 |
Chart of electron affinity on the periodic table. The data has been compiled in the following table:
| Row | Element | Electron Affinity (kJ/mol) |
|---|---|---|
| First | H | −73 |
| Second | Li | −60 |
| Second | Be | 241 |
| Second | B | −27 |
| Second | C | −122 |
| Second | N | ~0 |
| Second | O | −141 |
| Second | F | −328 |
| Third | Na | −53 |
| Third | Mg | 230 |
| Third | Al | −43 |
| Third | Si | −134 |
| Third | P | −72 |
| Third | S | −200 |
| Third | Cl | −349 |
| Fourth | K | −48 |
| Fourth | Ca | 156 |
| Fourth | Ga | −29 |
| Fourth | Ge | −119 |
| Fourth | As | −78 |
| Fourth | Se | −195 |
| Fourth | Br | −325 |
| Fifth | Rb | −47 |
| Fifth | Sr | 167 |
| Fifth | In | −29 |
| Fifth | Sn | −107 |
| Fifth | Sb | −103 |
| Fifth | Te | −190 |
| Fifth | I | −295 |
| Sixth | Cs | −46 |
| Sixth | Ba | 52 |
| Sixth | Ti | −19 |
| Sixth | Pb | −35 |
| Sixth | Bi | −35 |
Media Attributions
- “Increasing Effective Nuclear Charge” by Jessie A. Key © CC BY (Attribution)
- “Atomic Radii Trends on the Periodic Table” by David W. Ball © CC BY-NC-SA (Attribution-NonCommercial-ShareAlike)
- “Ionization Energy on the Periodic Table” by David W. Ball © CC BY-NC-SA (Attribution-NonCommercial-ShareAlike)
